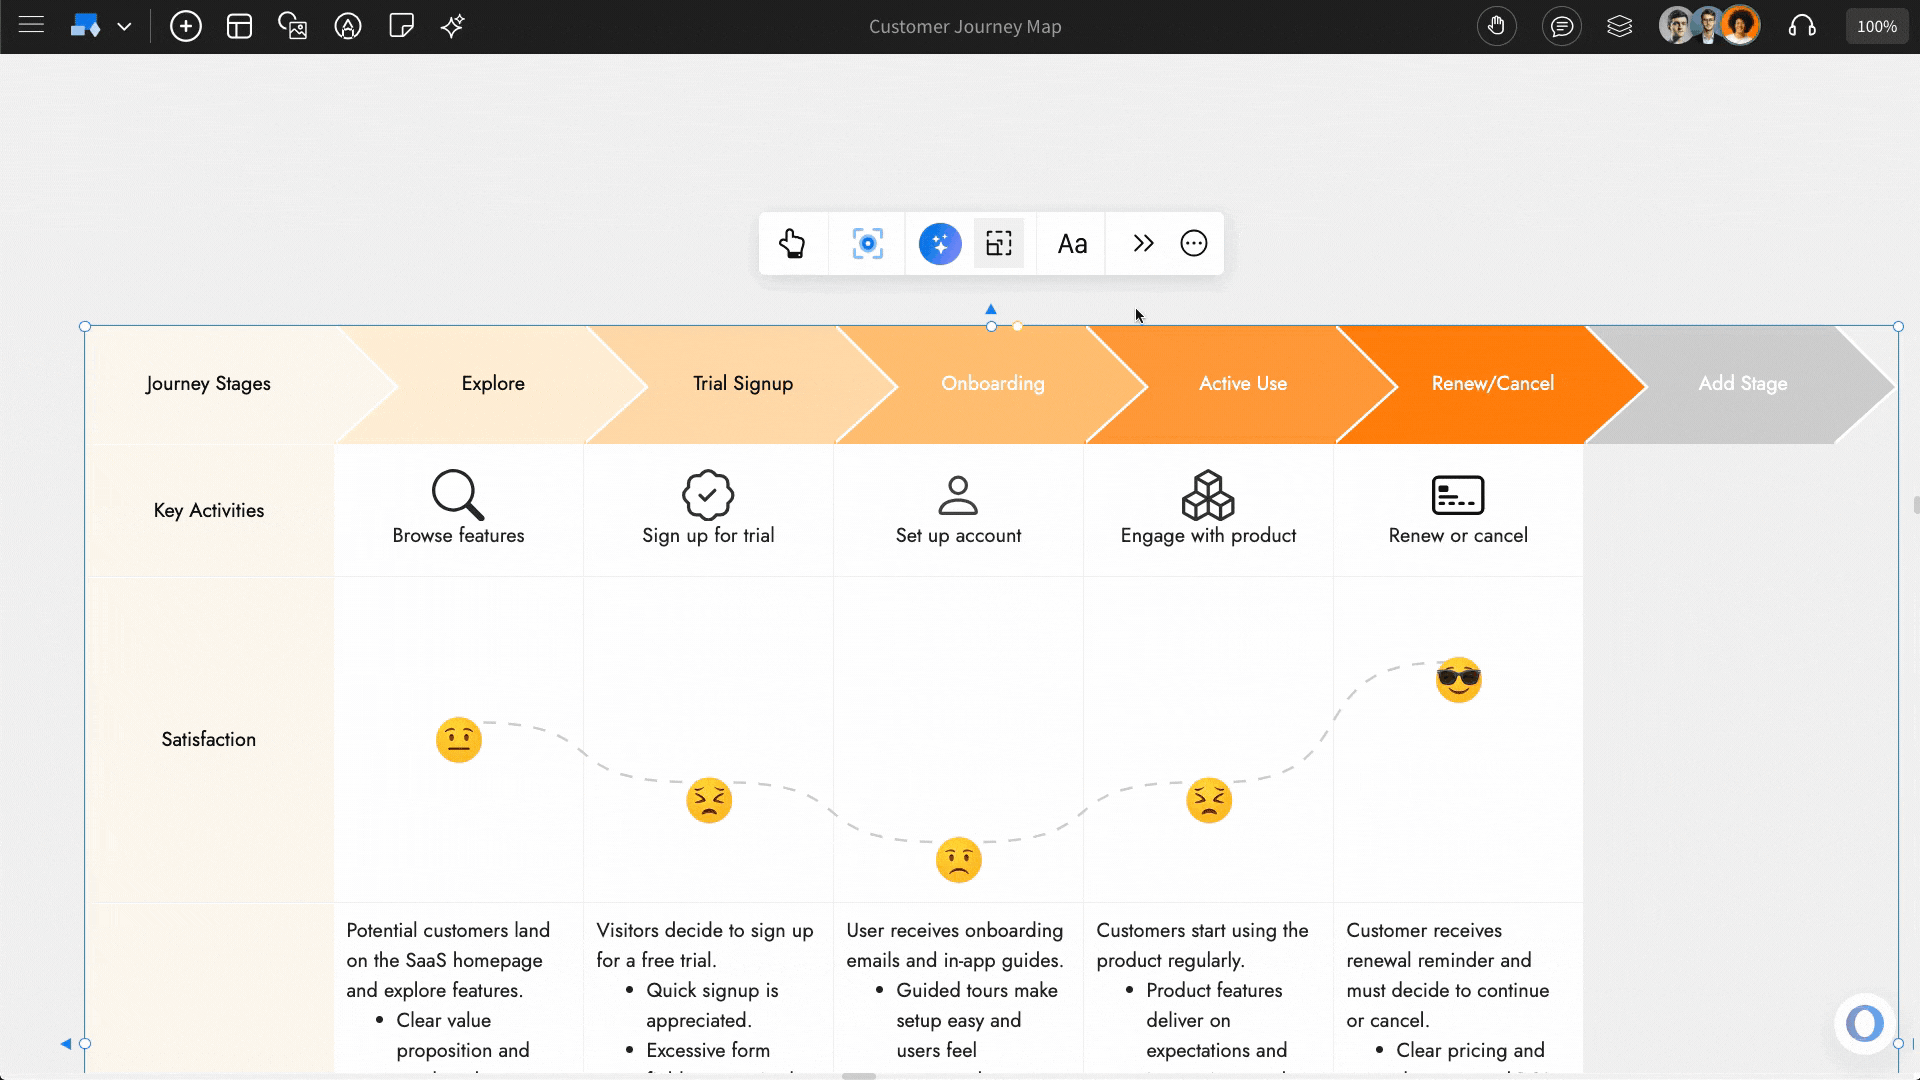
The Customer Journey Map component in IdeaBoard helps you visualize how customers interact with your product or service across different stages. Instead of scattered notes or siloed insights, this component provides a structured way to capture customer actions, emotions, and pain points all in one place on the whiteboard.
What is a Customer Journey Map?
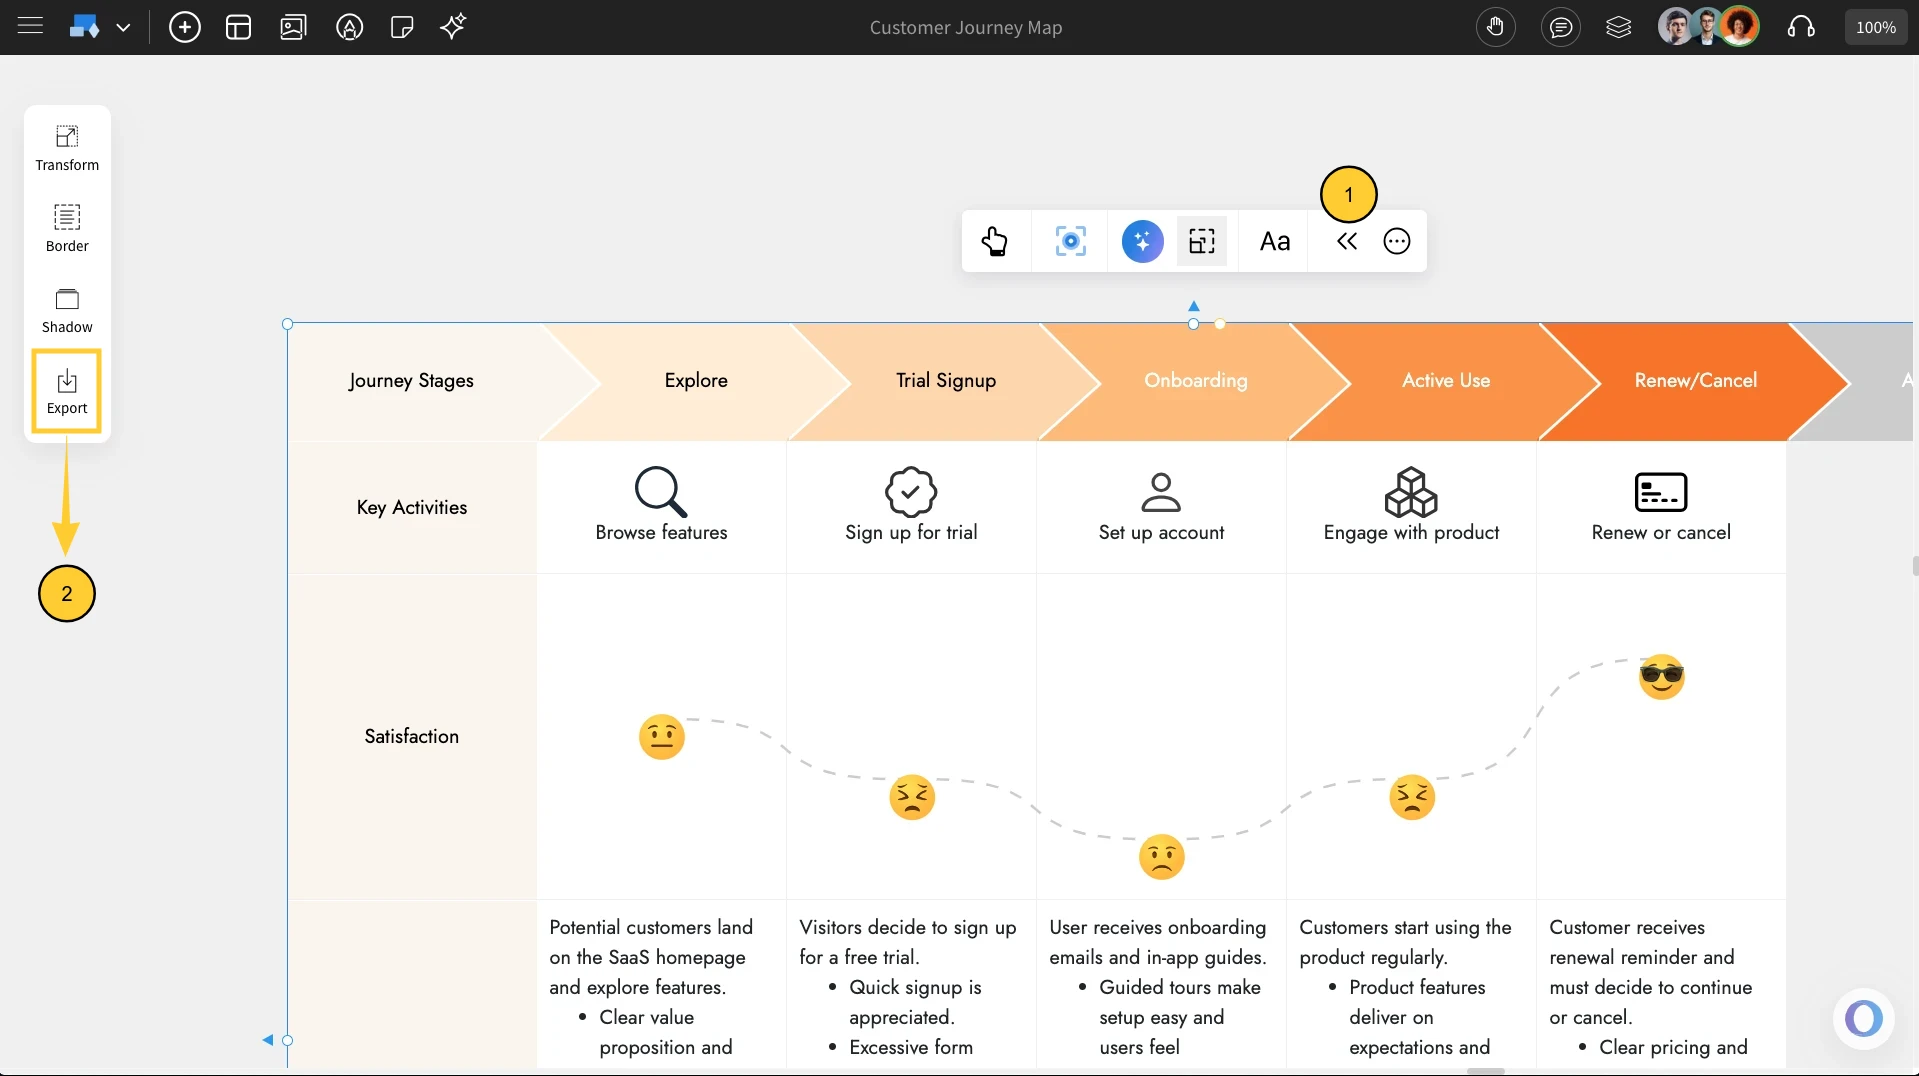
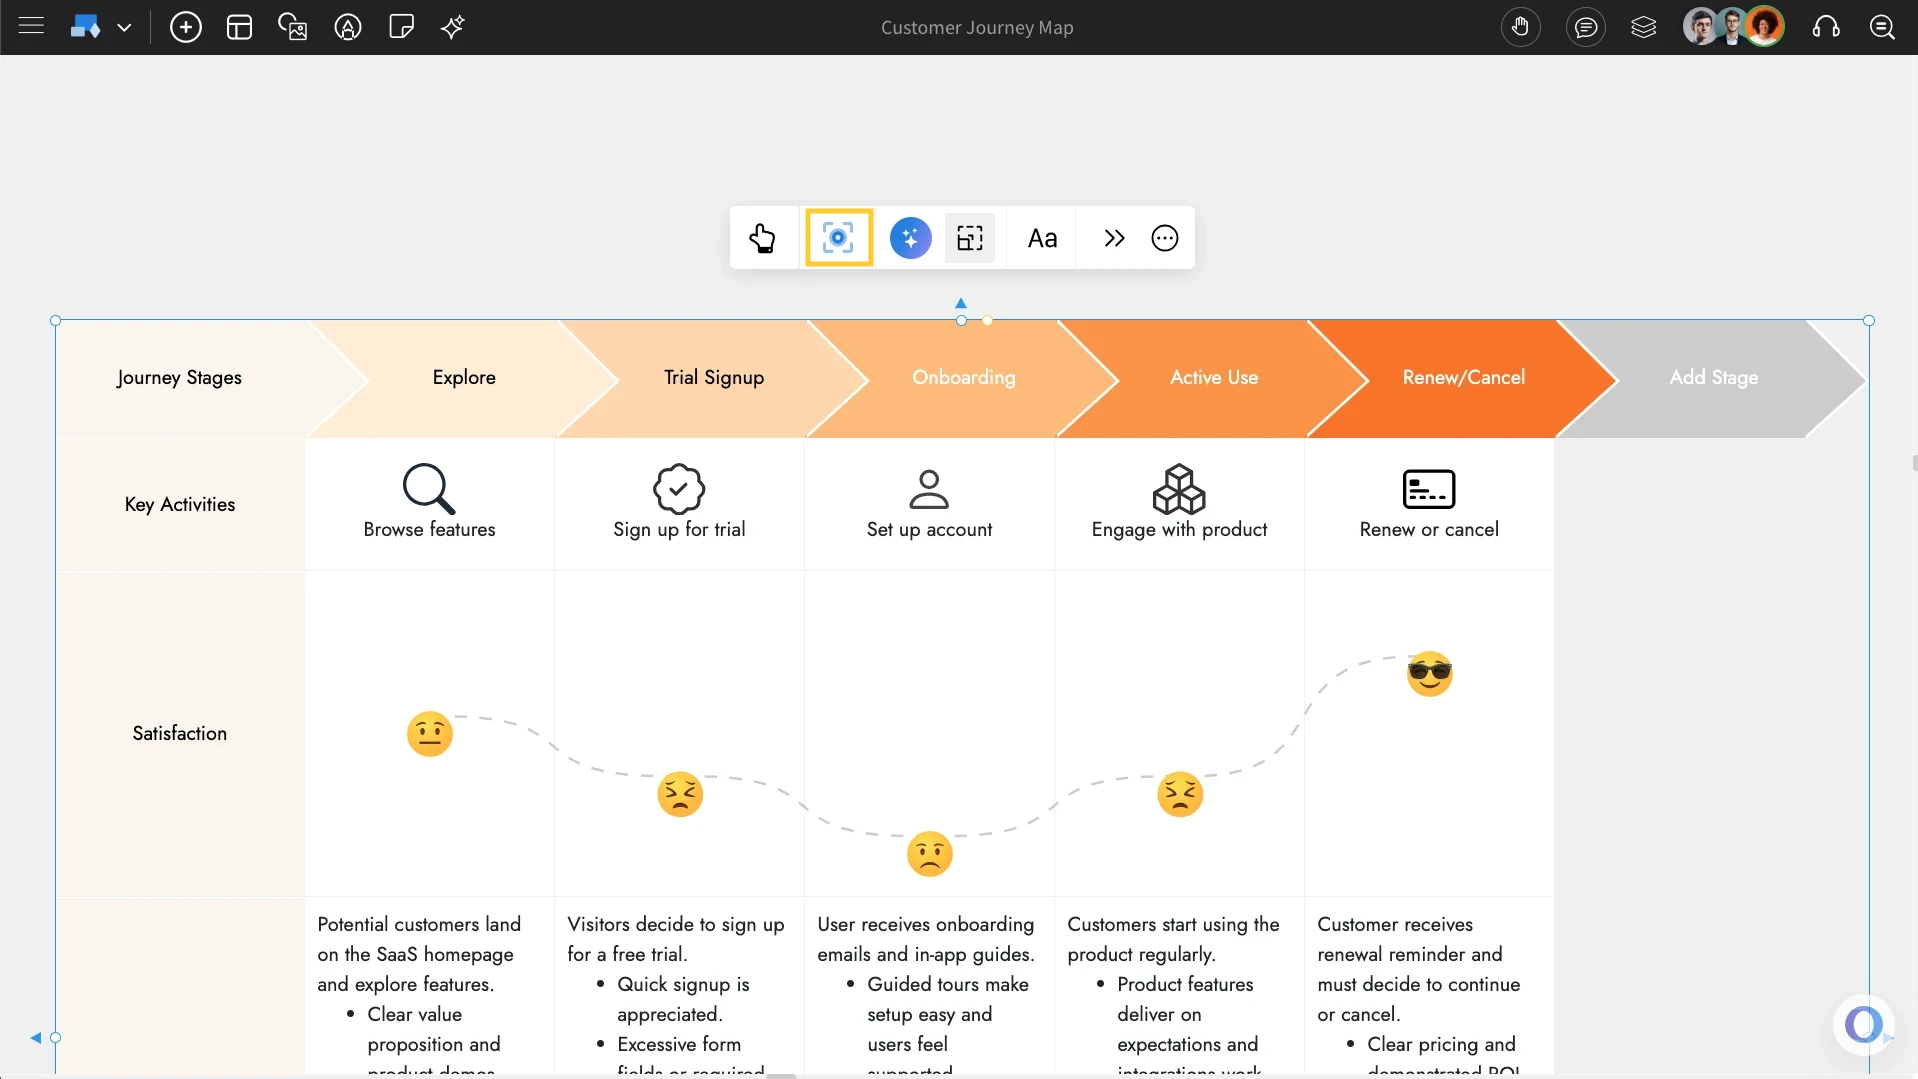
A customer journey map is a framework that represents the complete experience of a customer - from their first interaction with your brand to post-purchase support. The CJM component in IdeaBoard makes it simple to create this map using editable stages and rows so you can track user touch points and identify areas for improvement.
How to add a customer journey map?
Click the 'Add' icon on the board, locate 'Customer Journey Map,' and drag it onto the canvas.
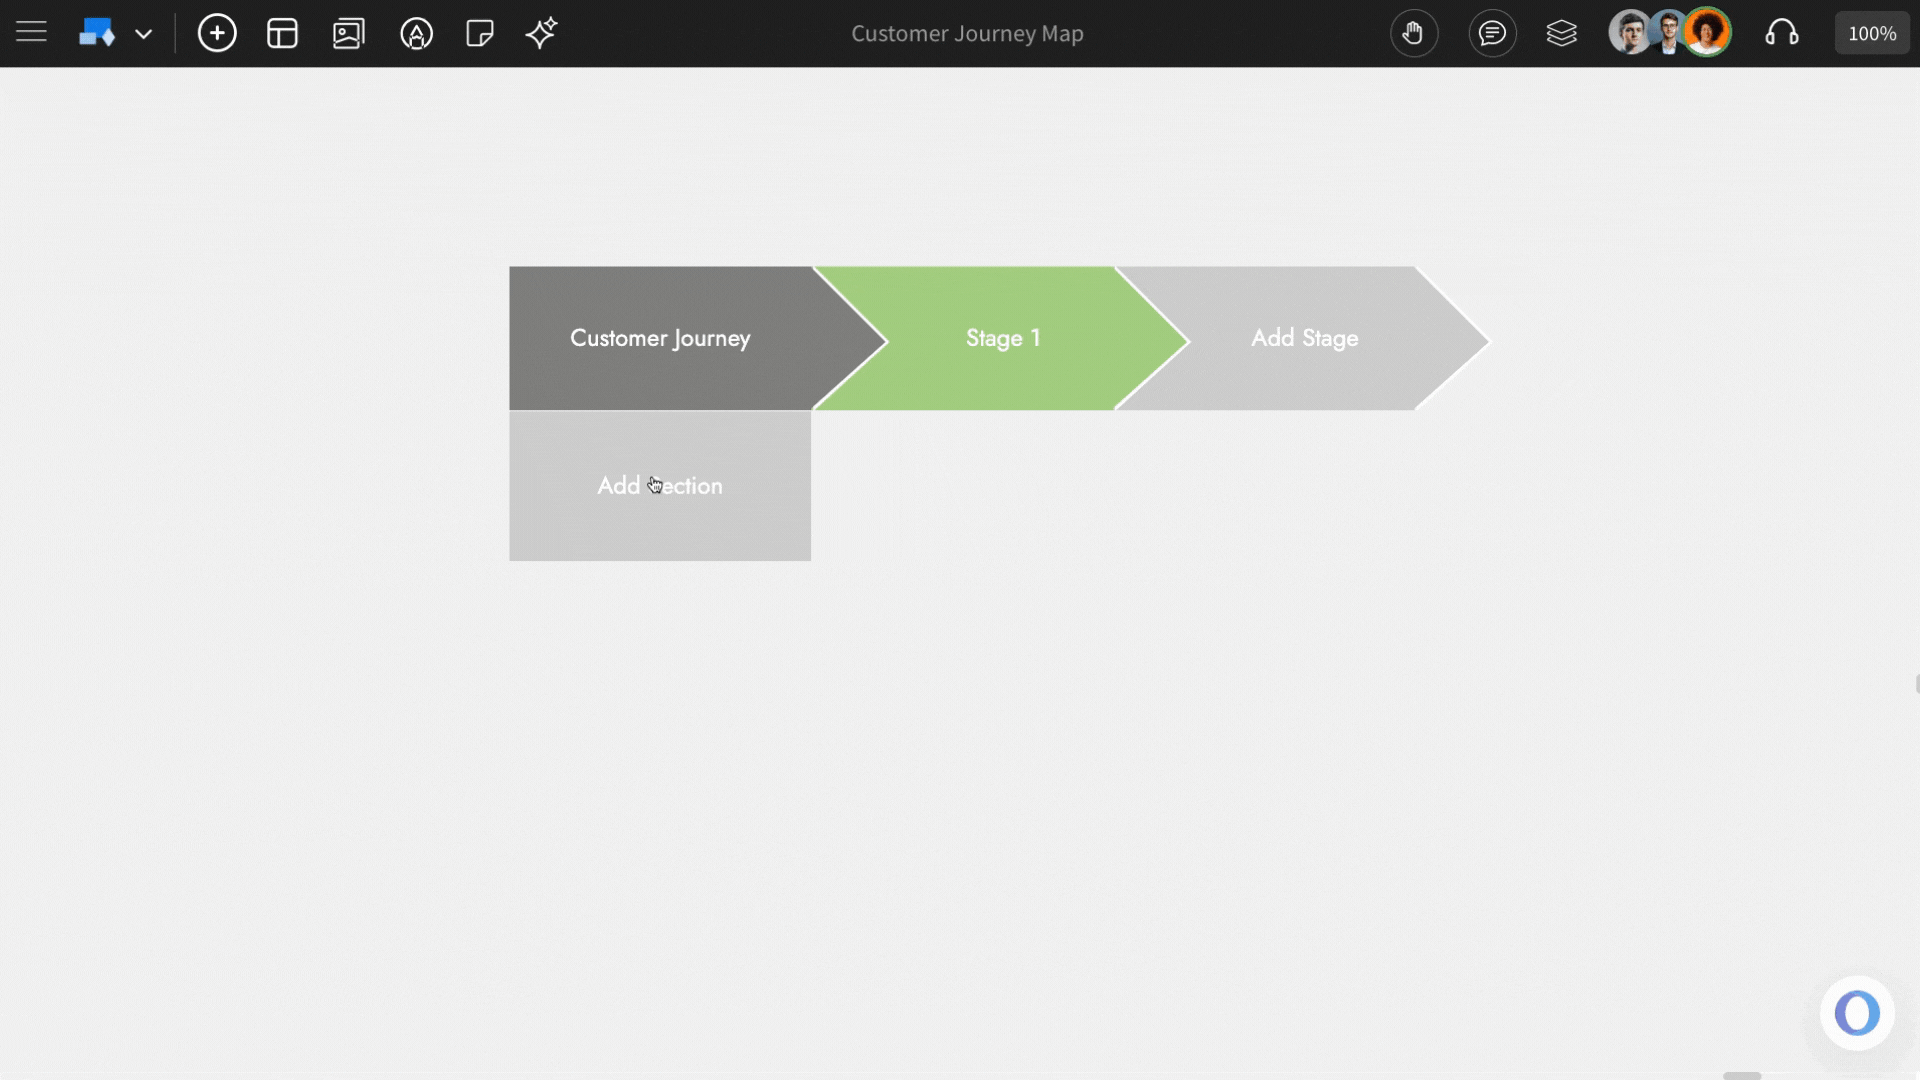
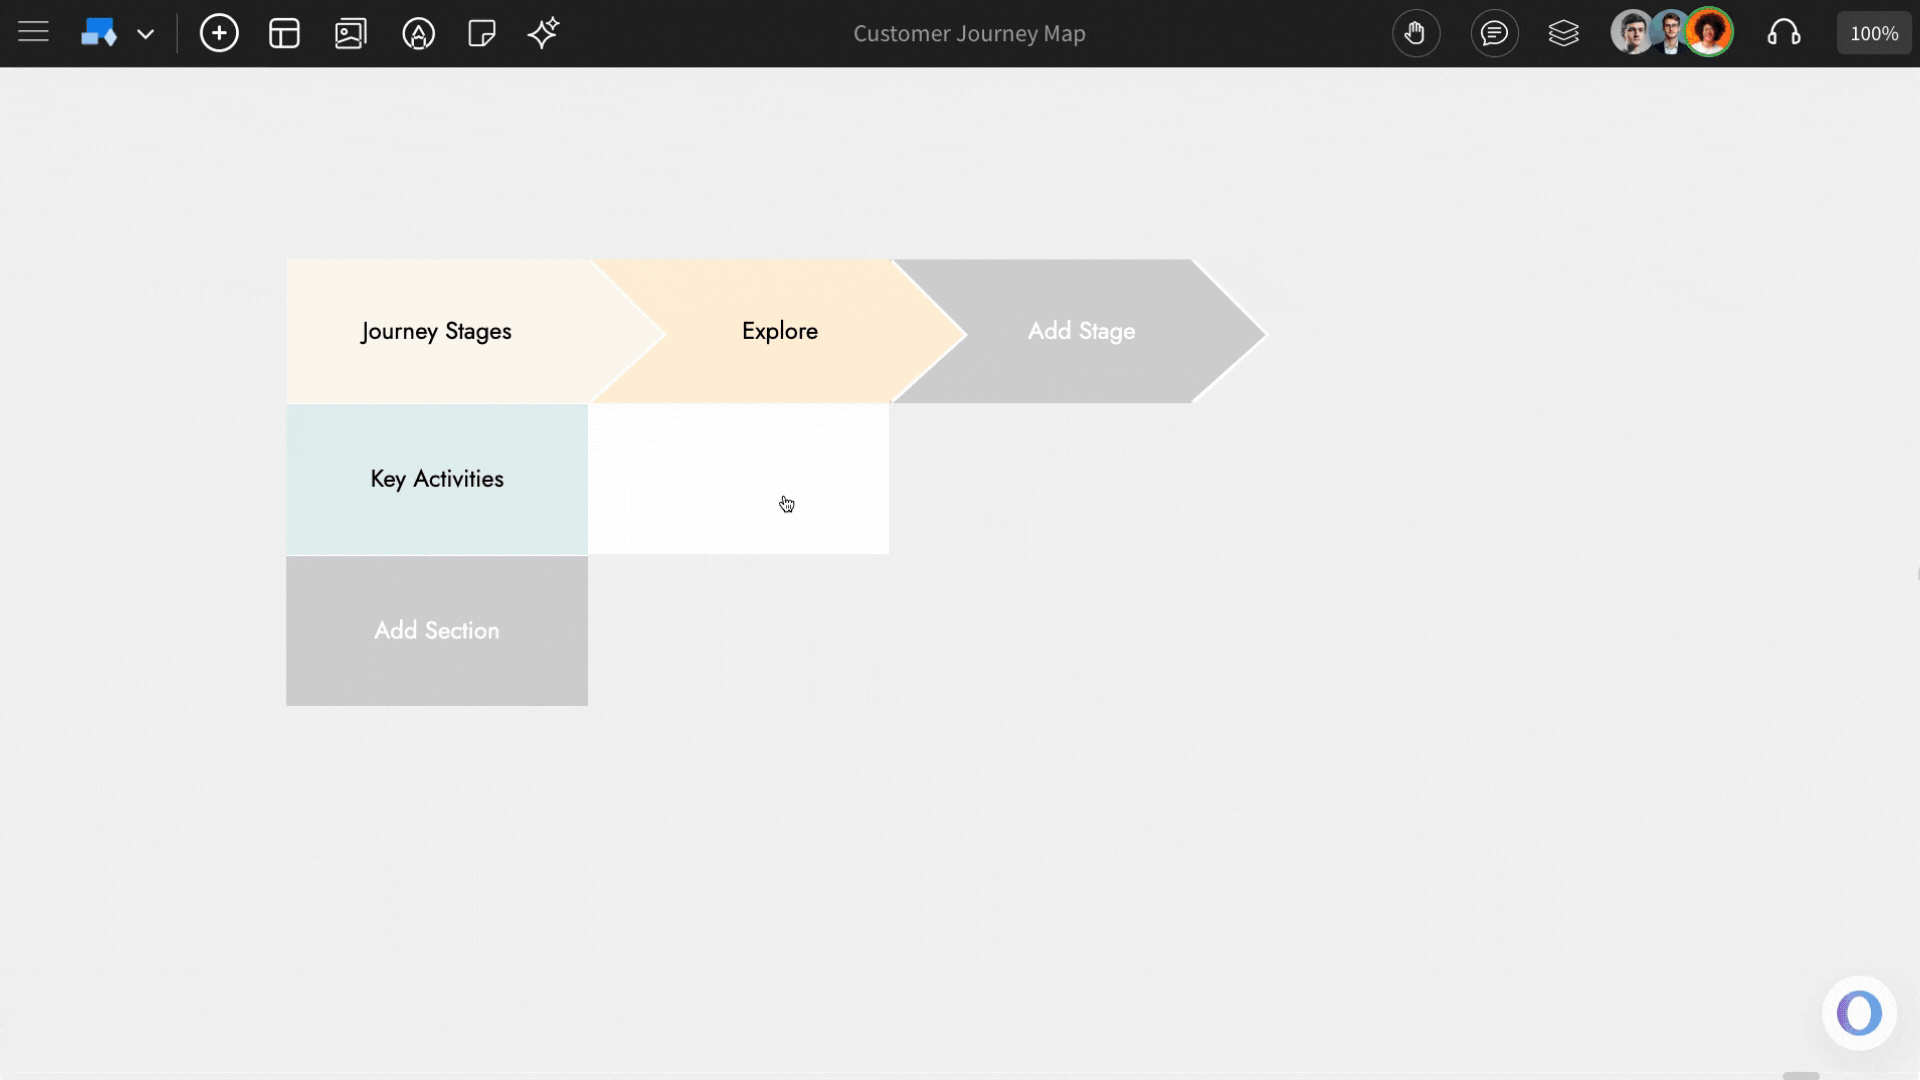
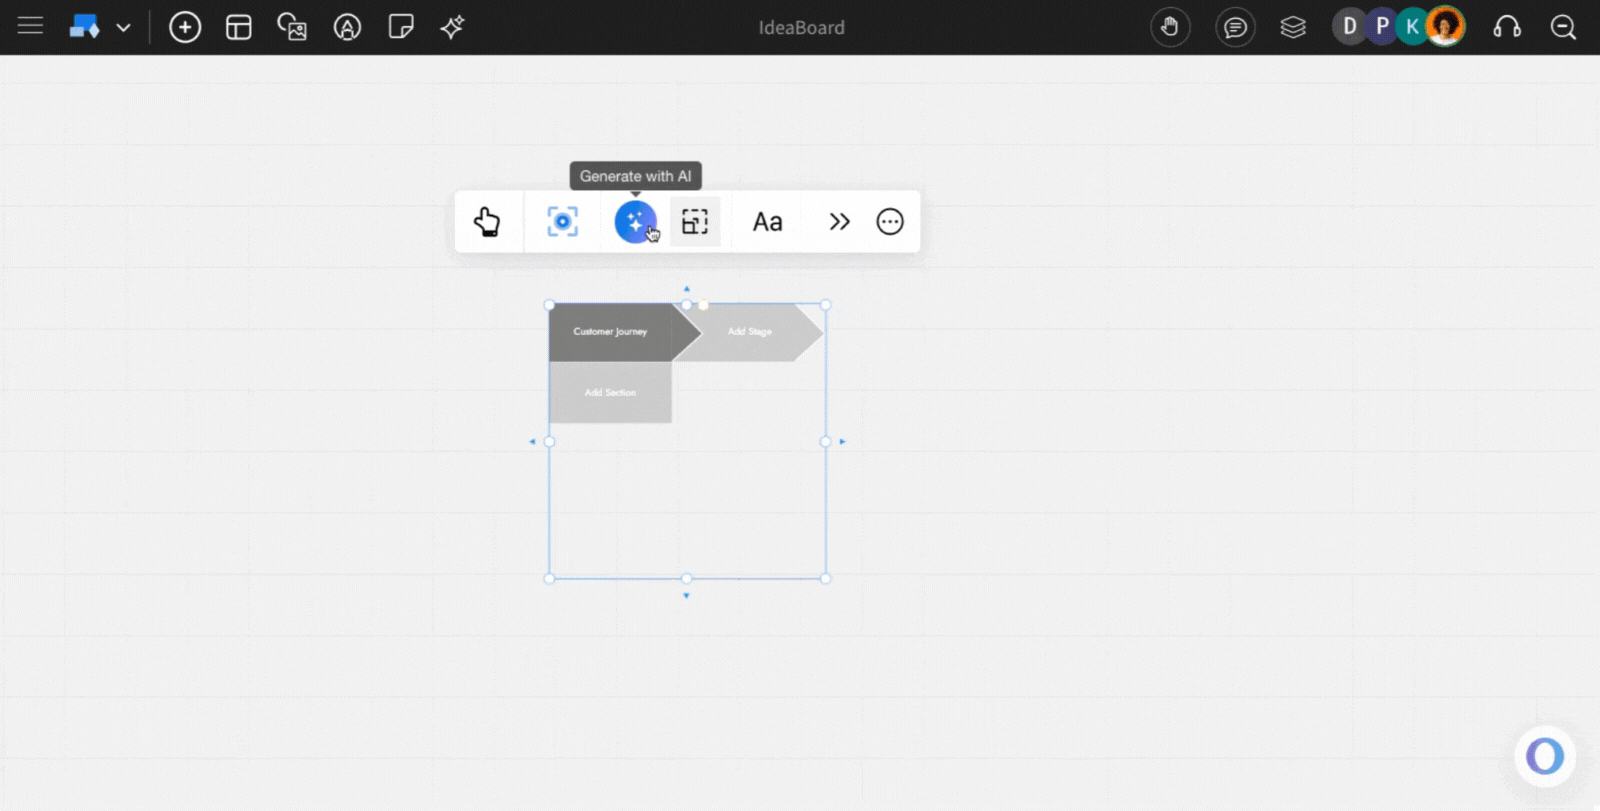
Adding stages in the customer journey map: To add stages (columns) to the customer journey map, click on the 'Add Stages' in the component. To edit the name and background colour, just double-click on the stage.
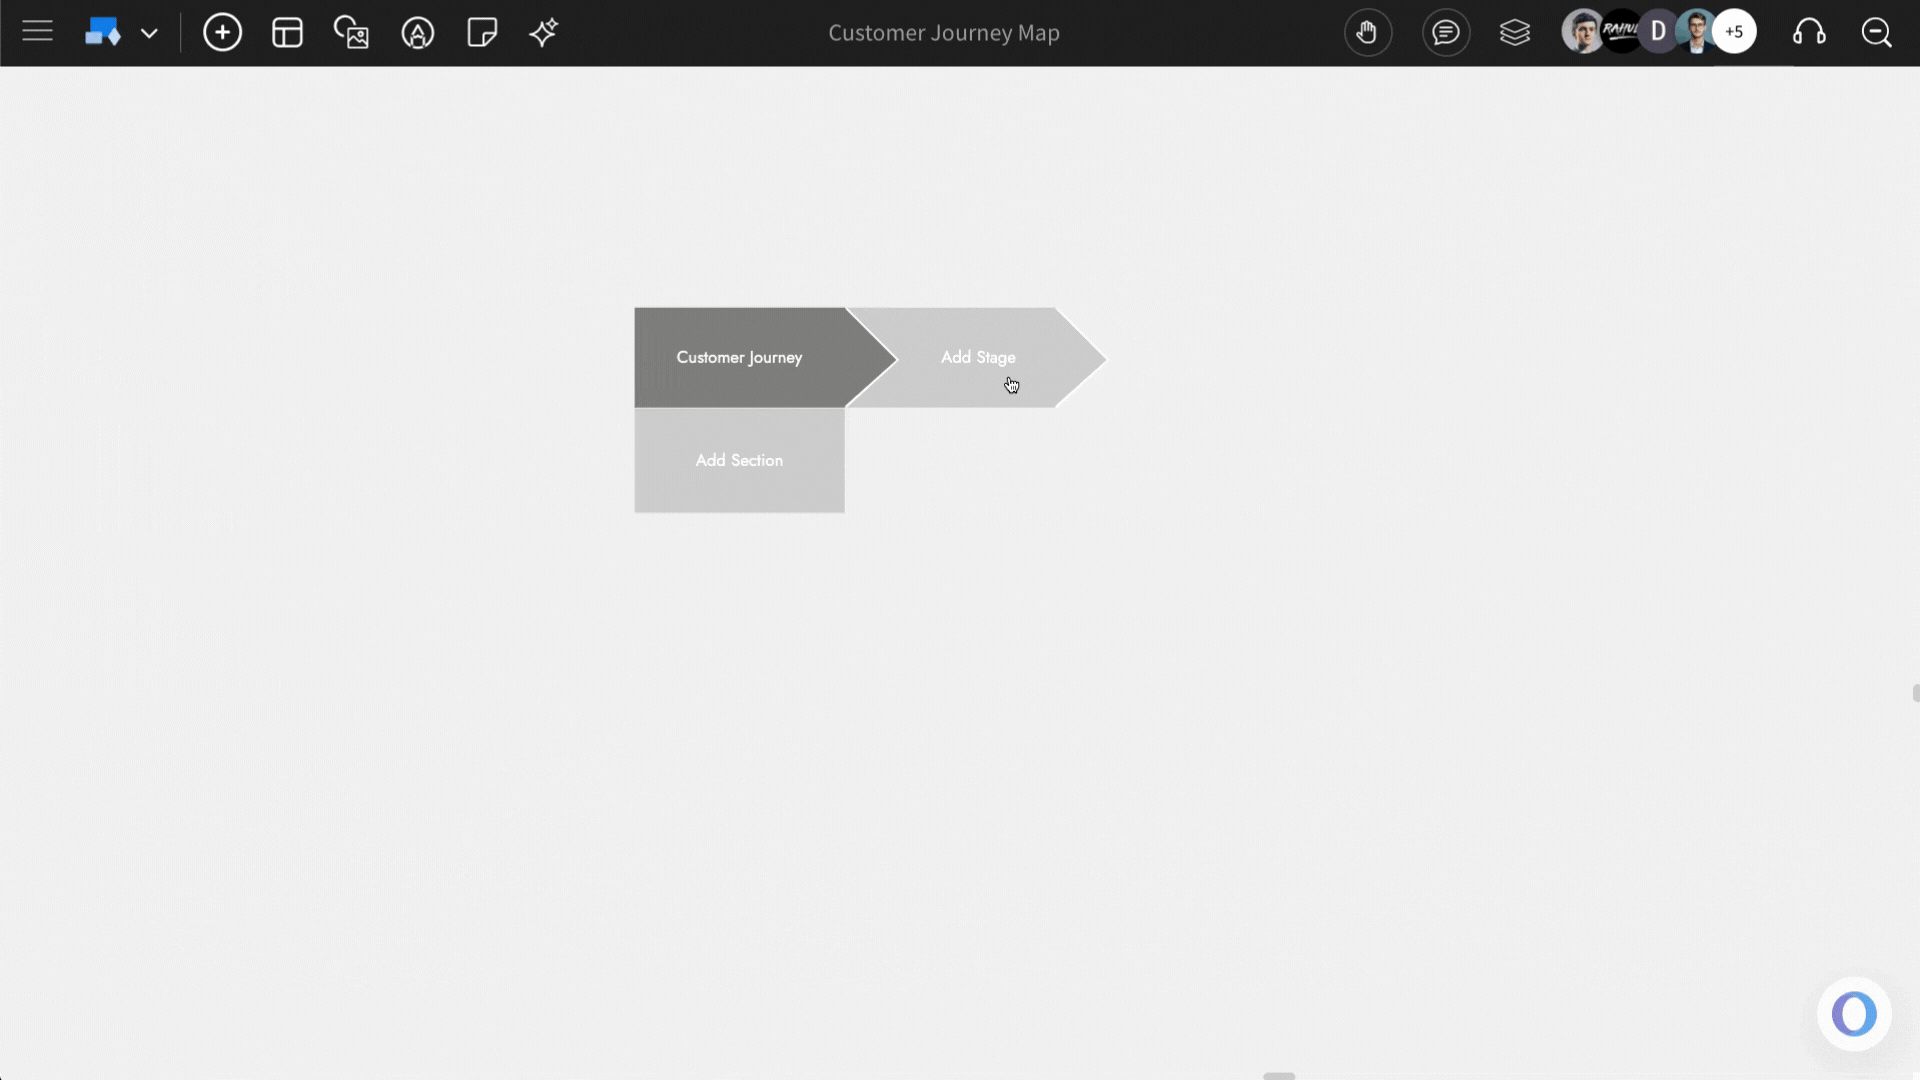
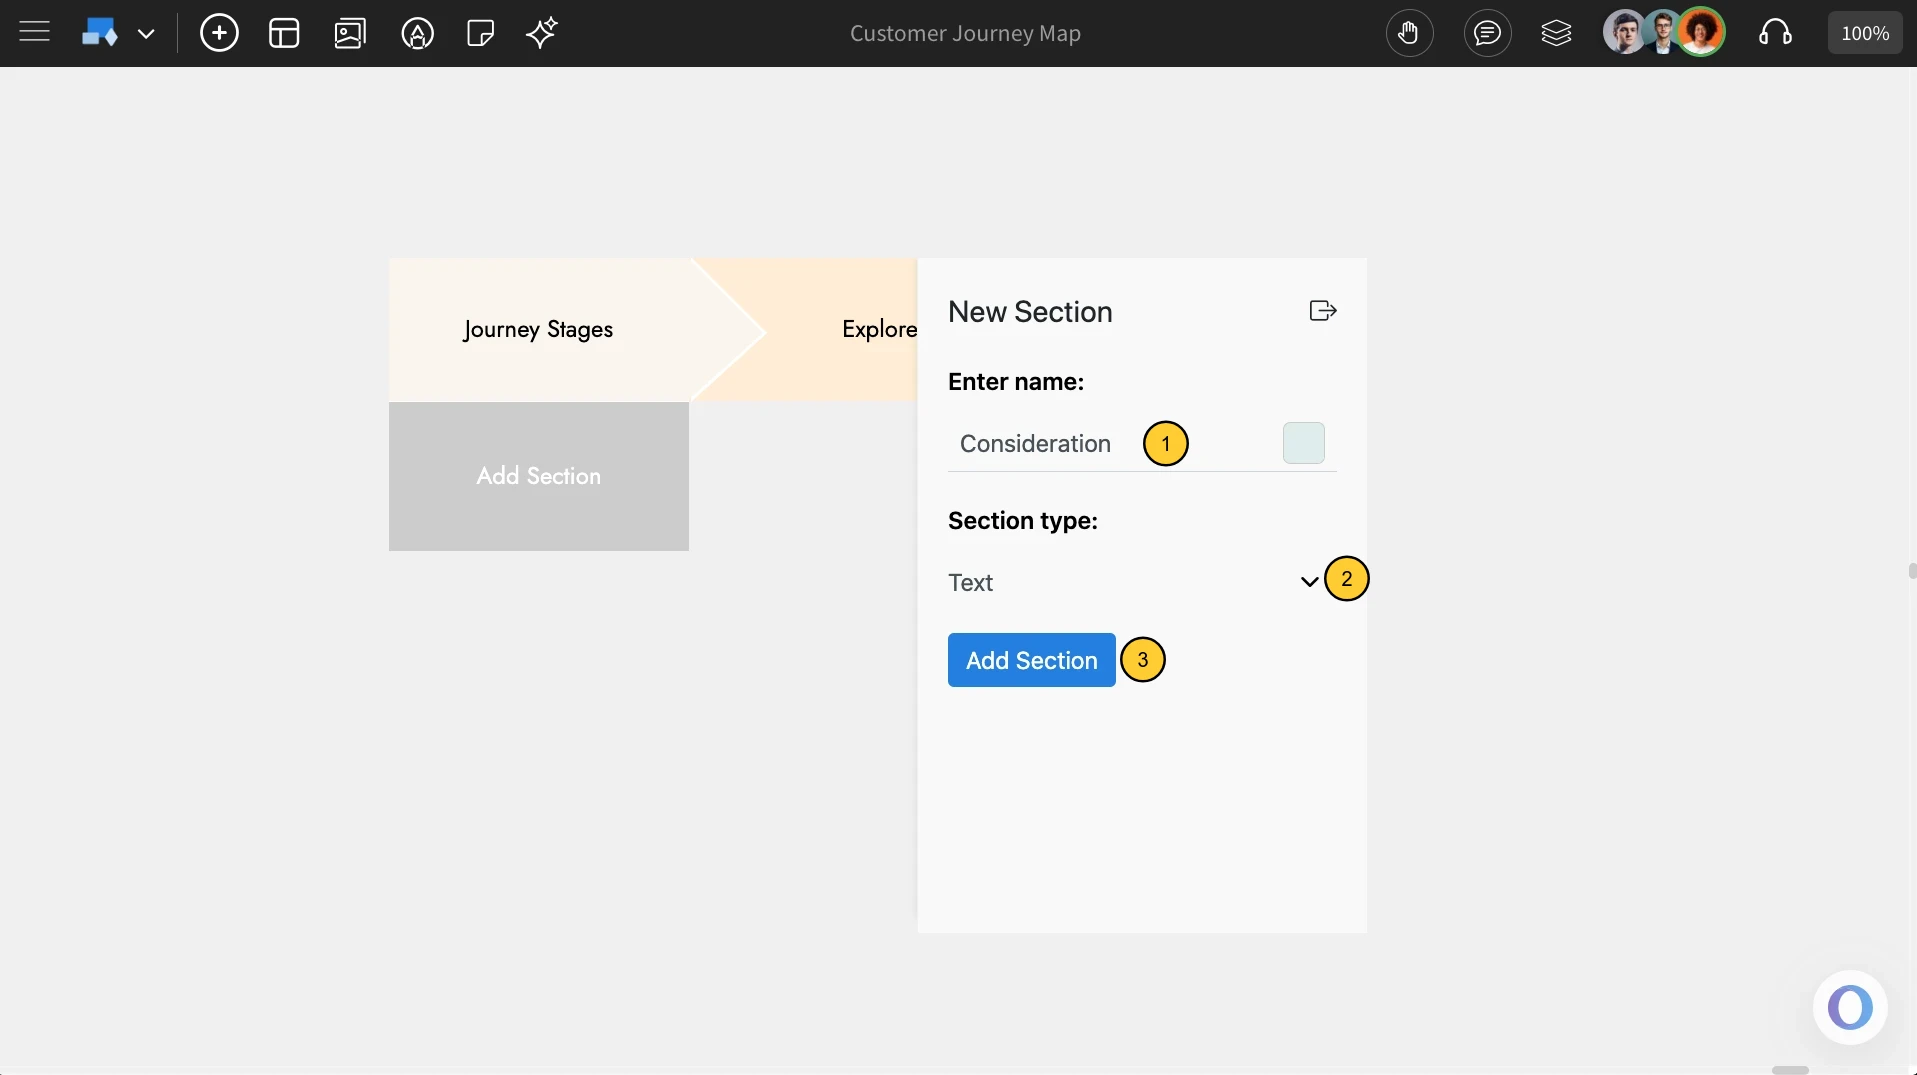
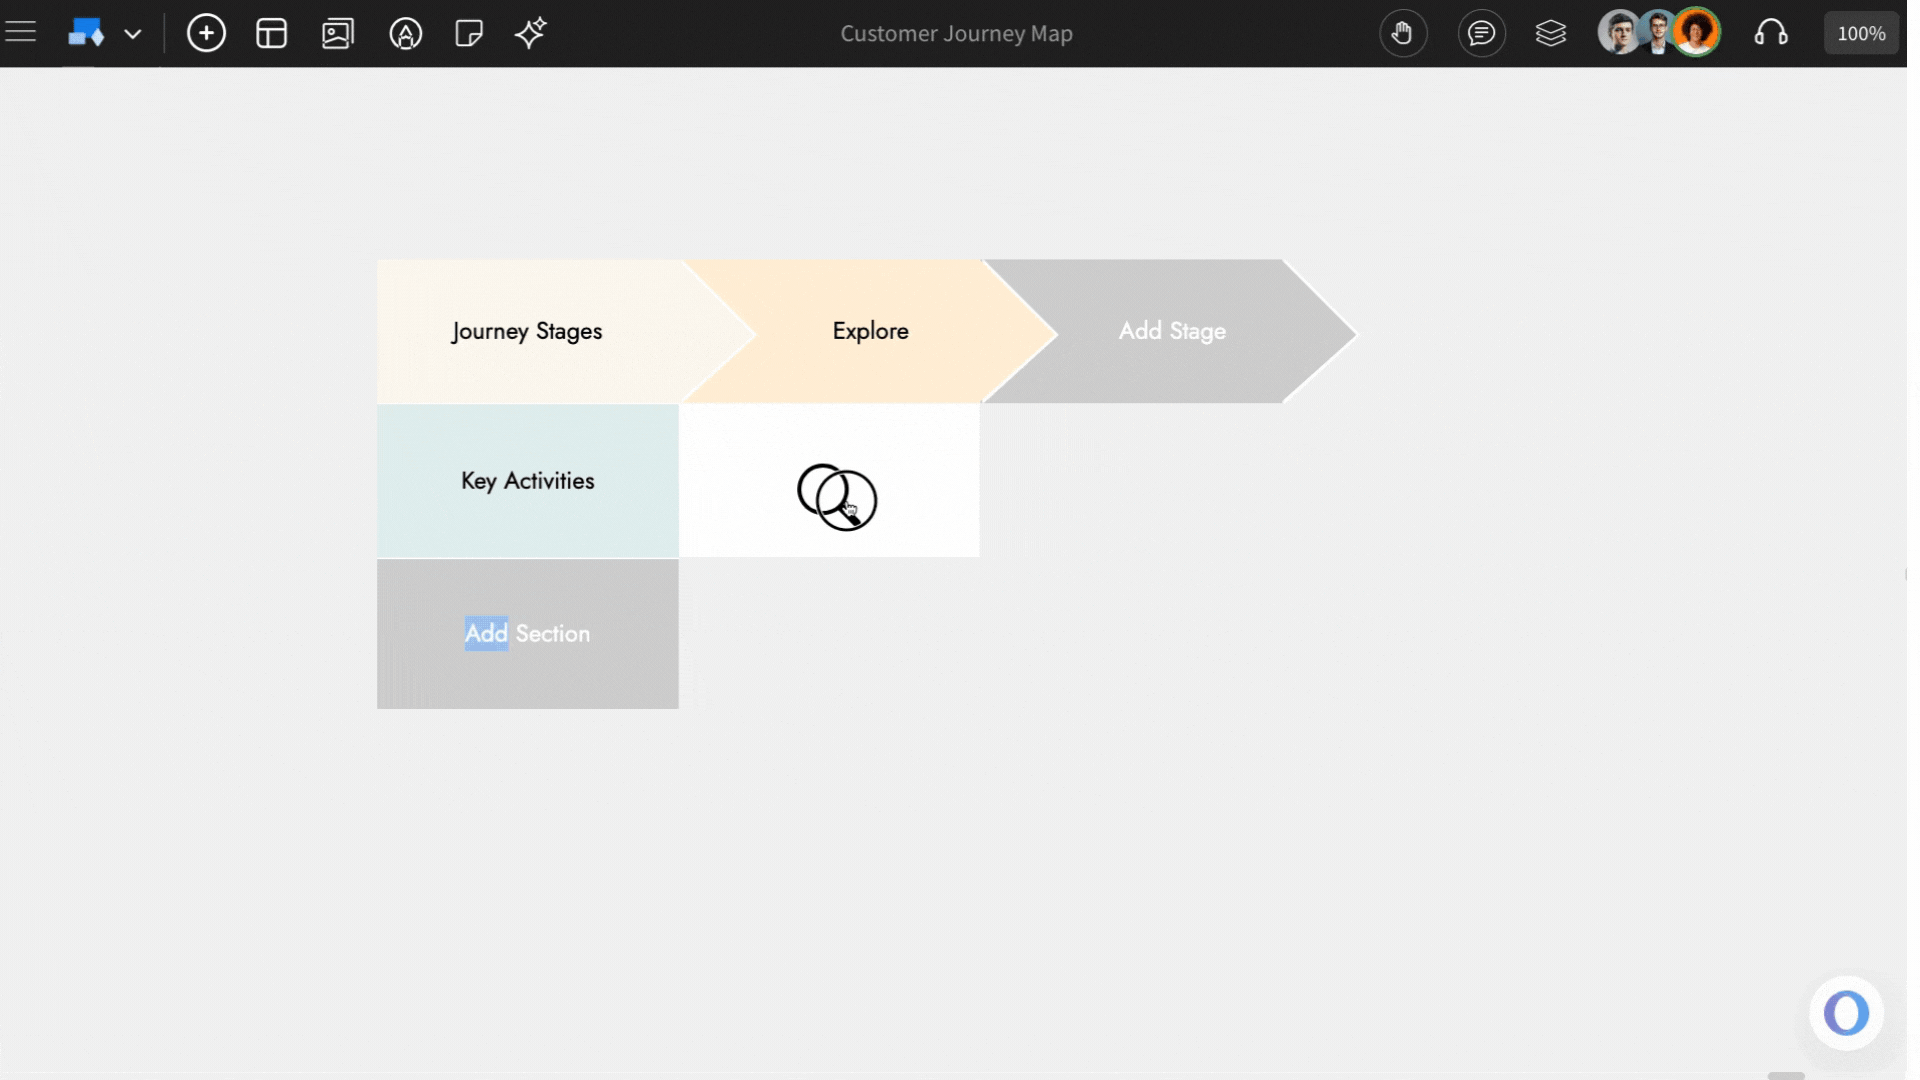
Adding sections in the customer journey map: To add sections (rows) to the customer journey map, click on the 'Add Section' in the component.
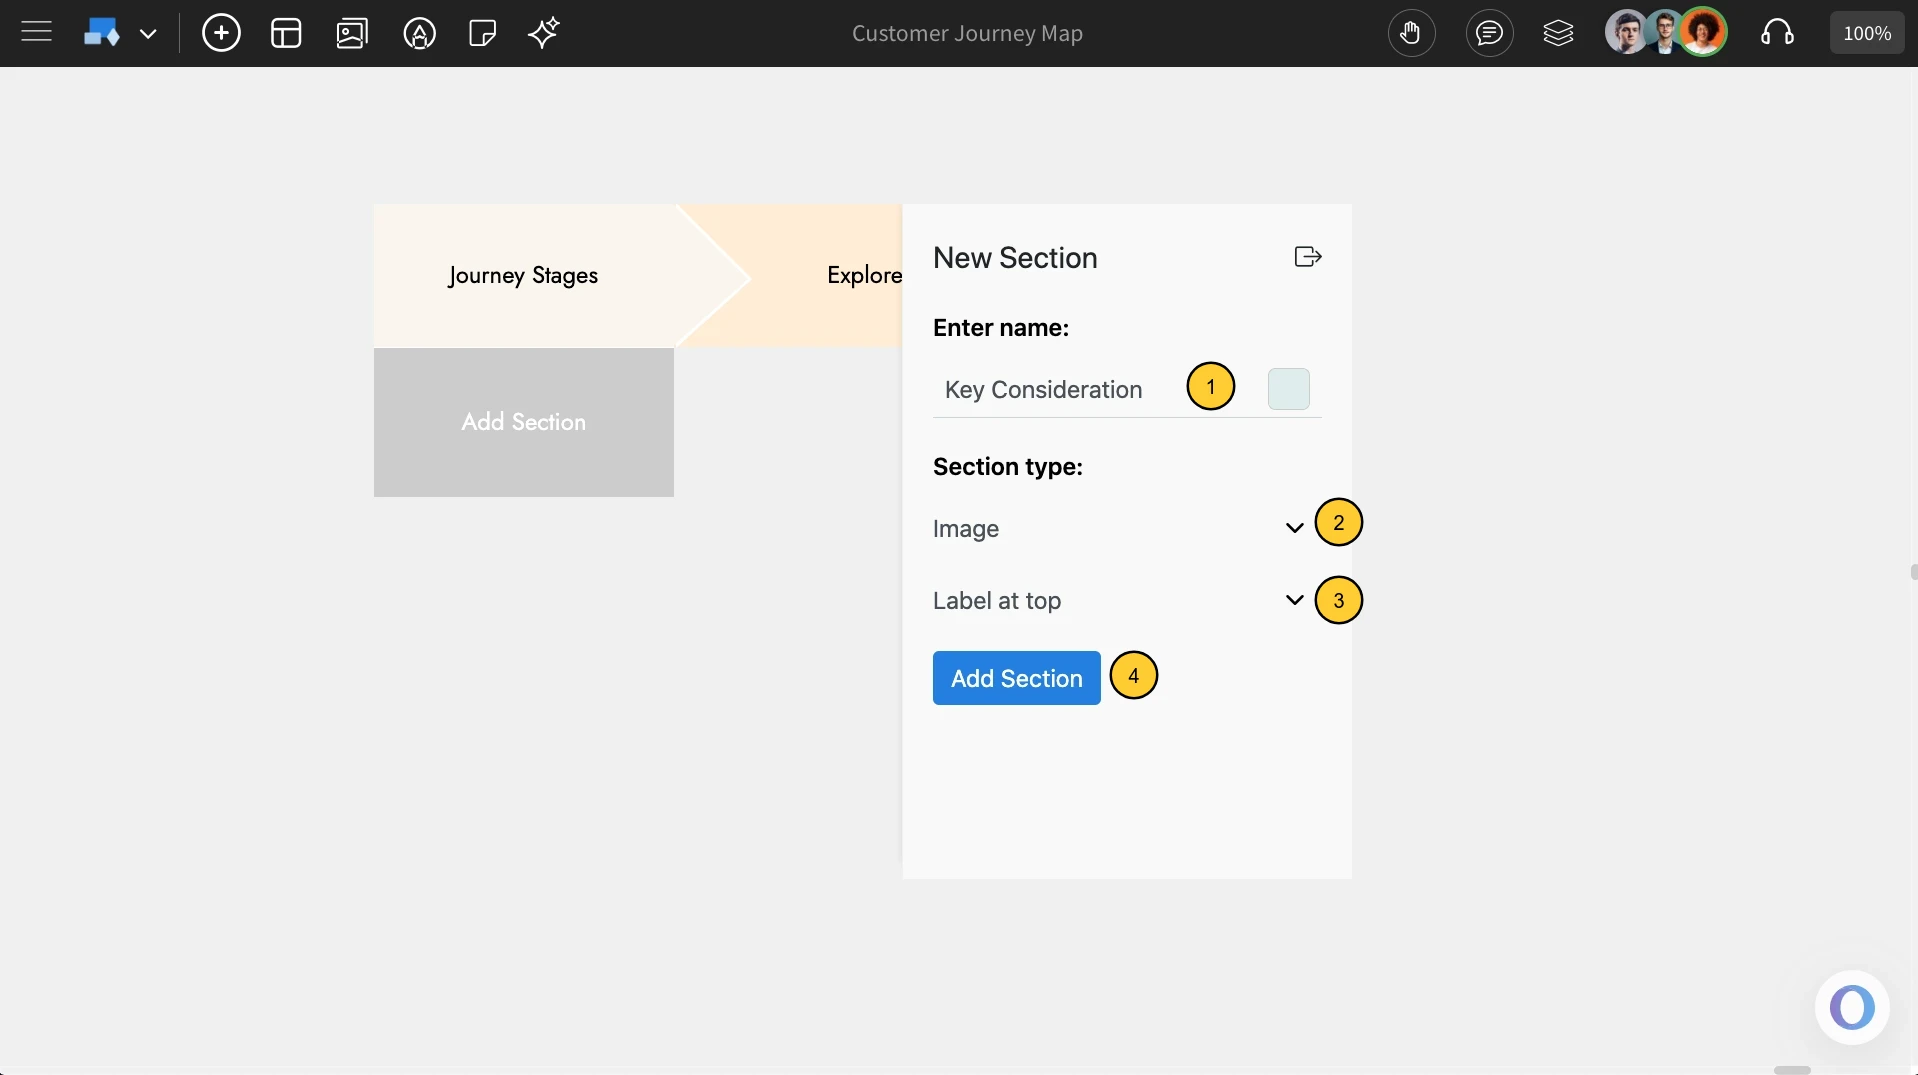
You can enter the name of the section, select a background colour, and you will also be able to set the section type.
The different section types that are available in the CJM component are: Text, Icon, Image and Graph.
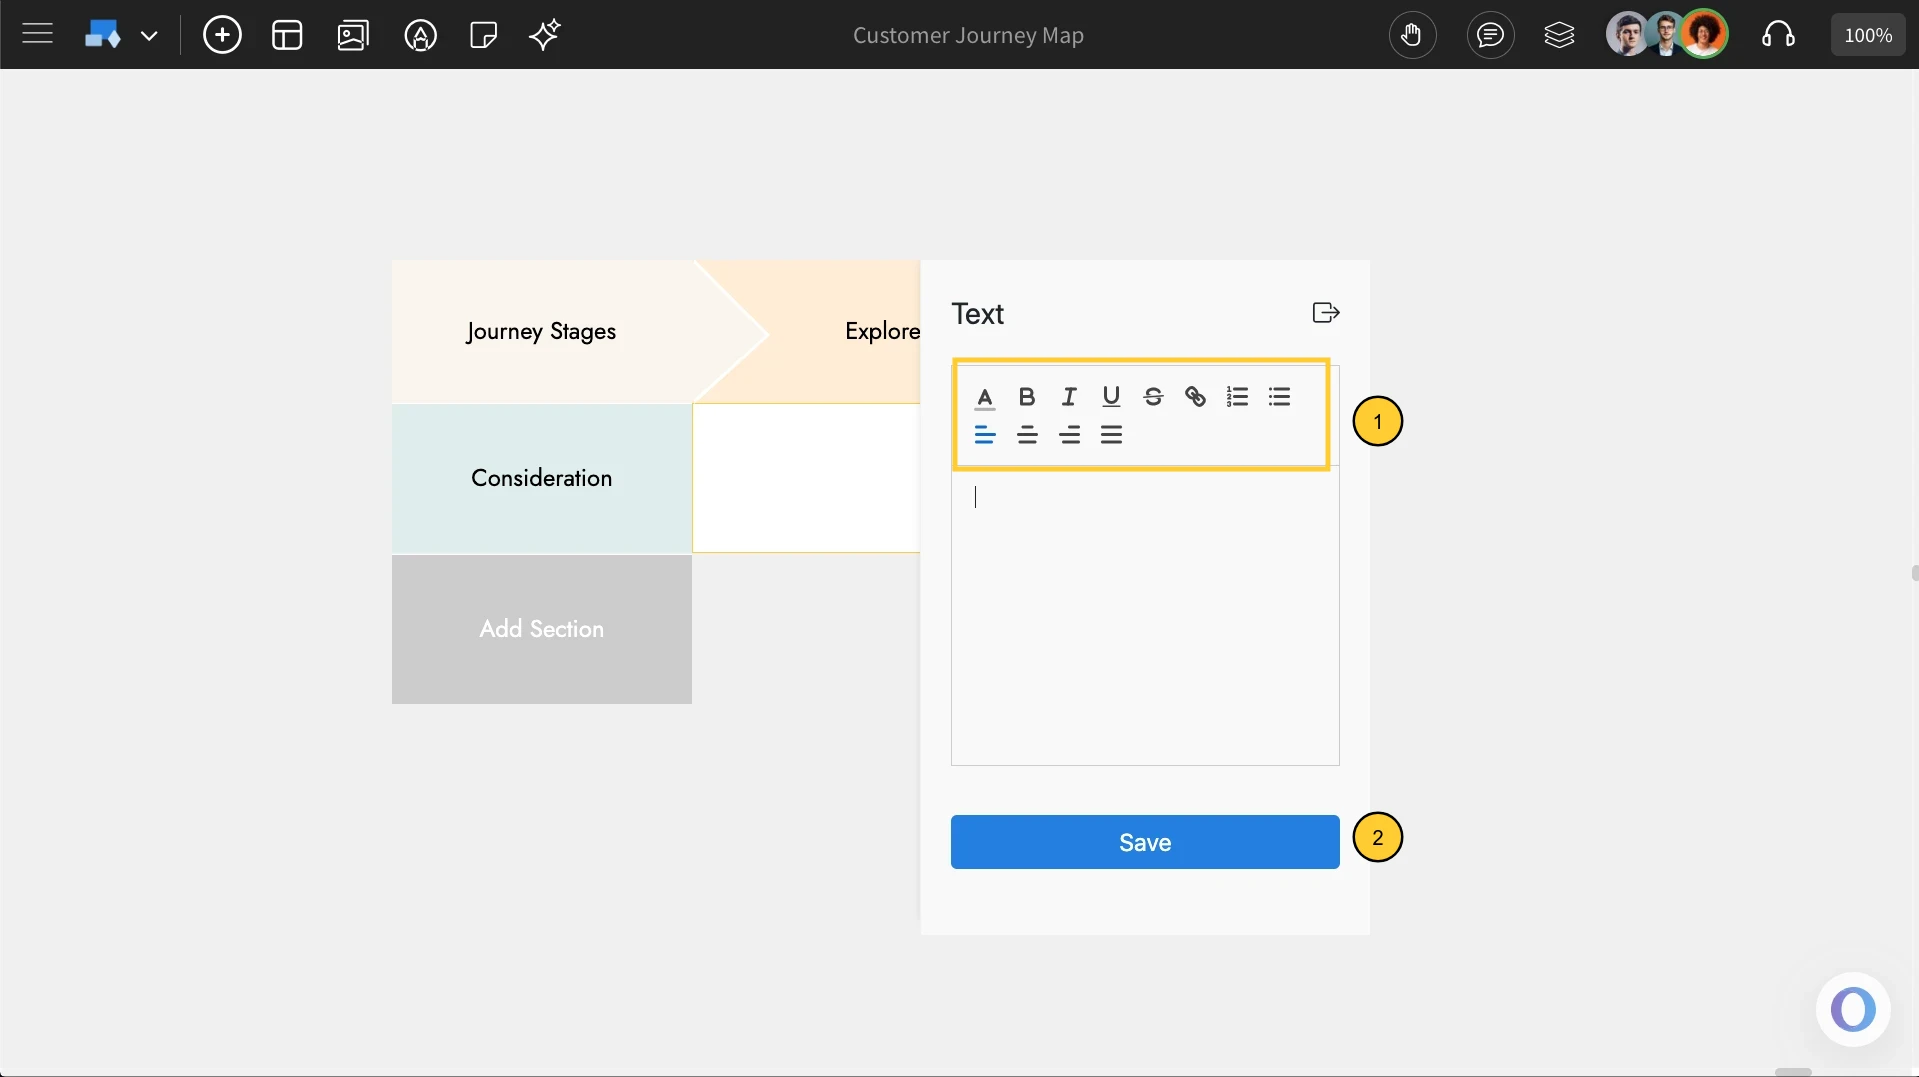
1. Text :In the 'Add section' pop-up field, enter the section name, select ‘Text’ as the section type, and then click the ‘Add Section’ button to create it.
To enter text, double click and enter the text in the mini editor that opens with formatting options. Once you’re done editing, click ‘Save’ to apply the changes.
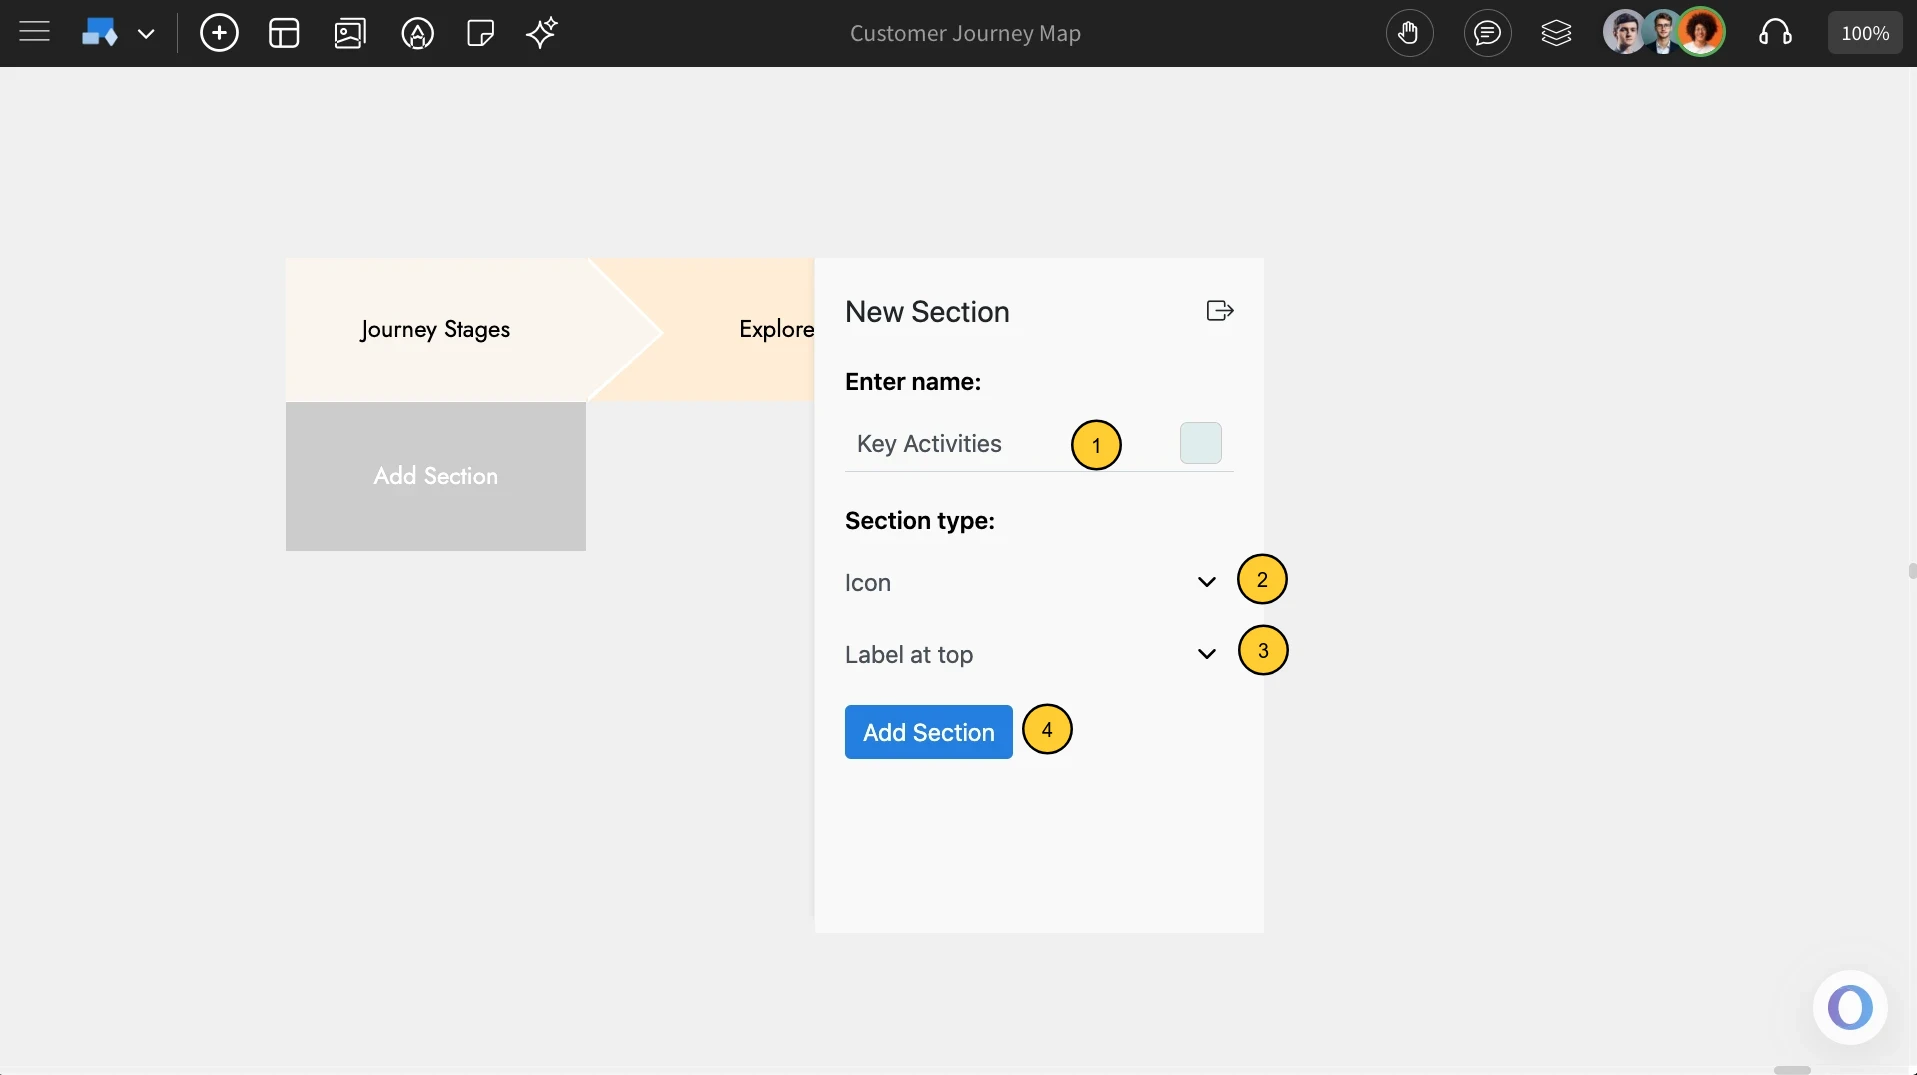
2. Icon: Use the Icon section type to visually represent each journey stage with icons.
In the 'Add section' pop-up field, enter the section name, select ‘Icon’ as the section type, and choose the label position - either Top or Bottom.
Adding icons: Double-click the cell and add icons by clicking ‘Add Icons’, then choose from the built-in icon library. You can also modify the icon size and color.
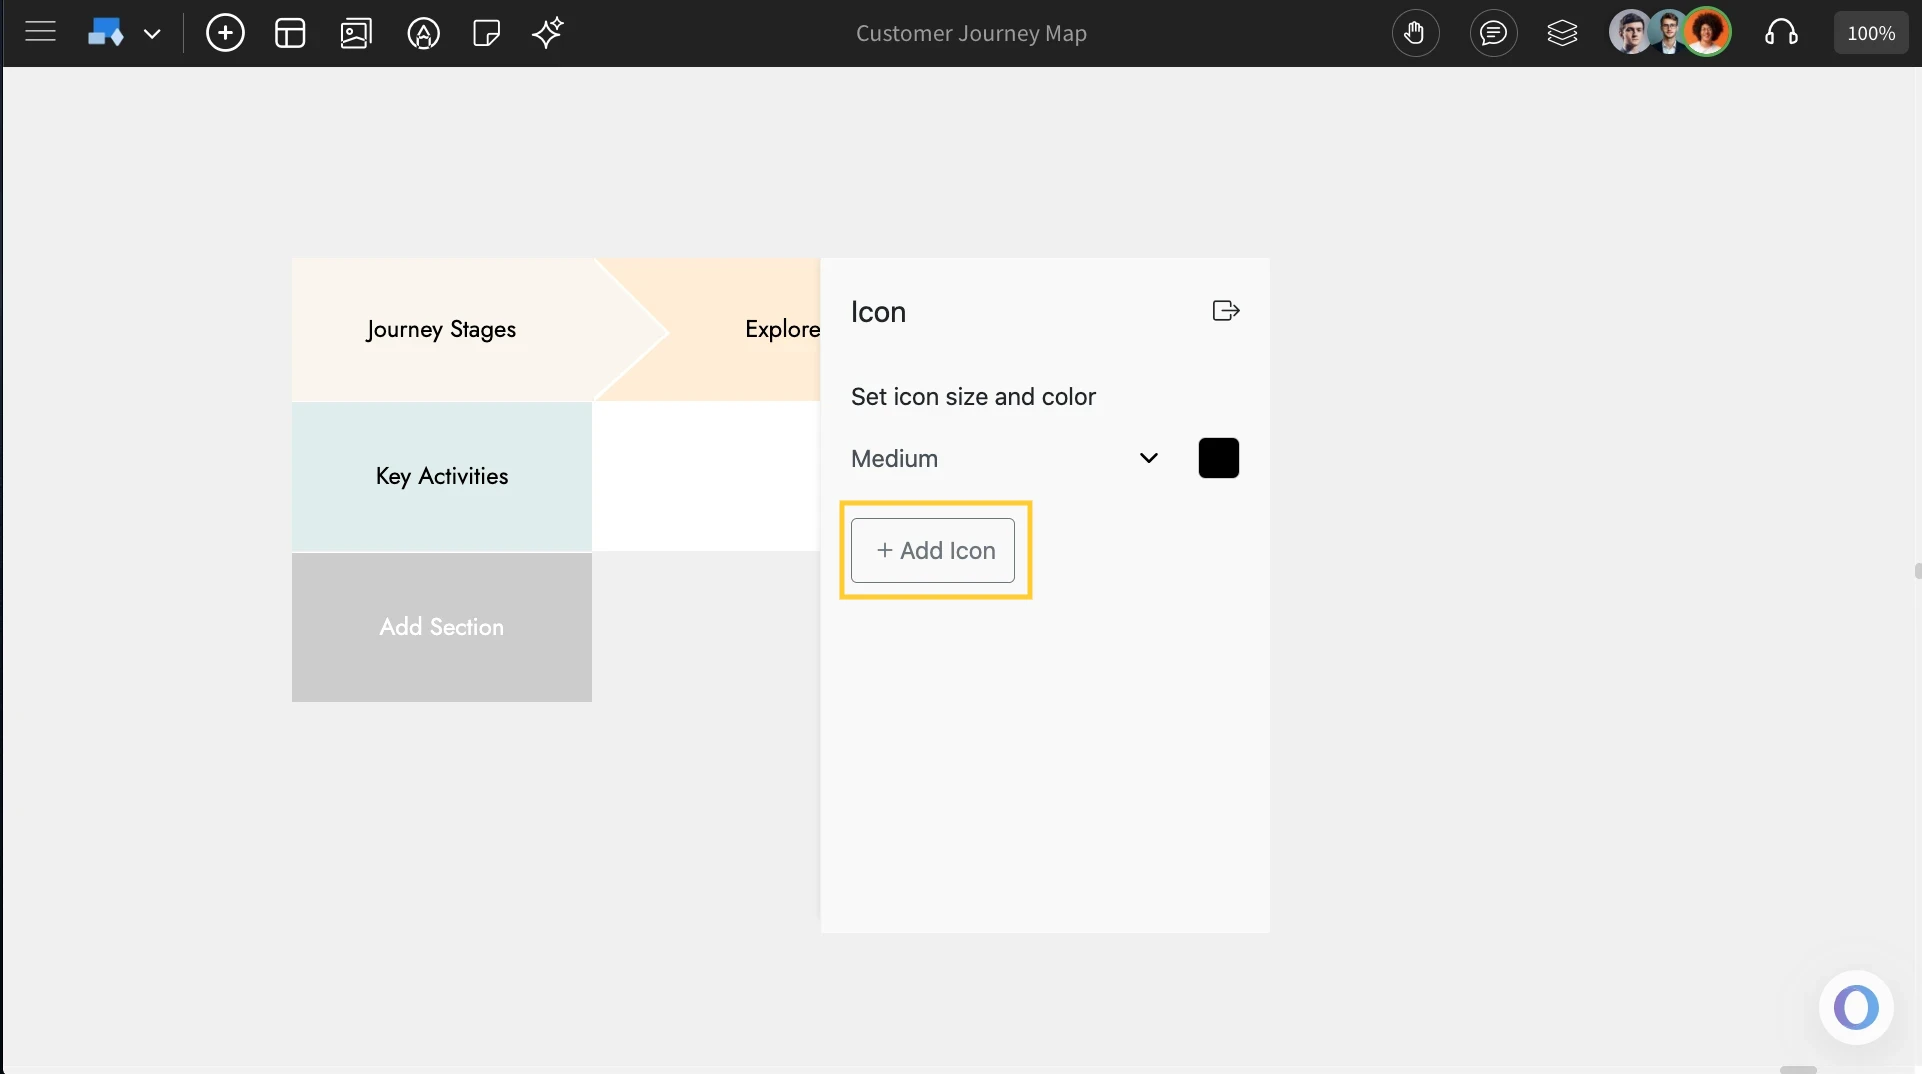
Labeling each icon: You can also label each icon for better clarity.
3. Image : The Image section type allows you to represent journey stages using images.
Choosing the Image type: You can access the Image section type by clicking on ‘Add Section’. In the pop-up field, enter the section name, select ‘Image’ as the section type, and choose the label position — either Top or Bottom. Once done, click ‘Add Section’ to create it.
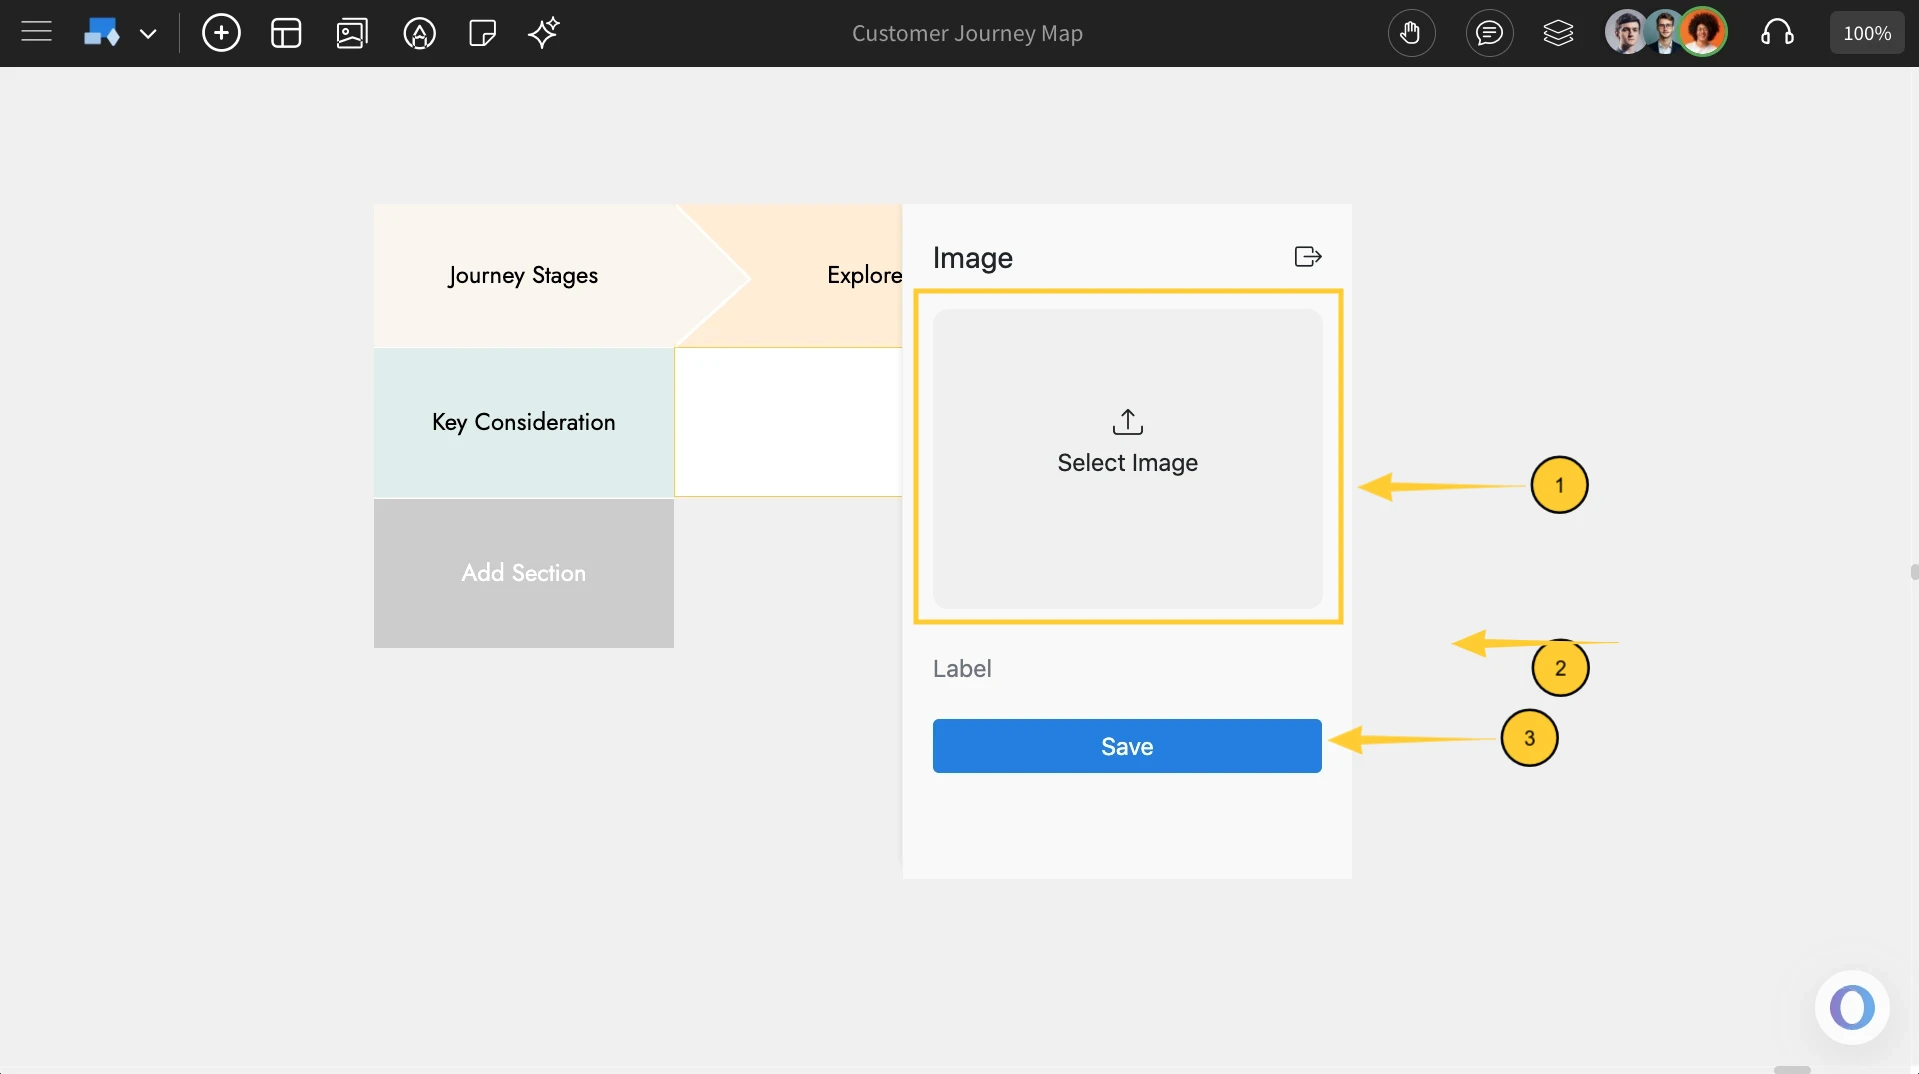
After selecting ‘Image’ as the section type:
Importing an image: Upload an image from your system and add a label to describe it, and click on 'Save.'
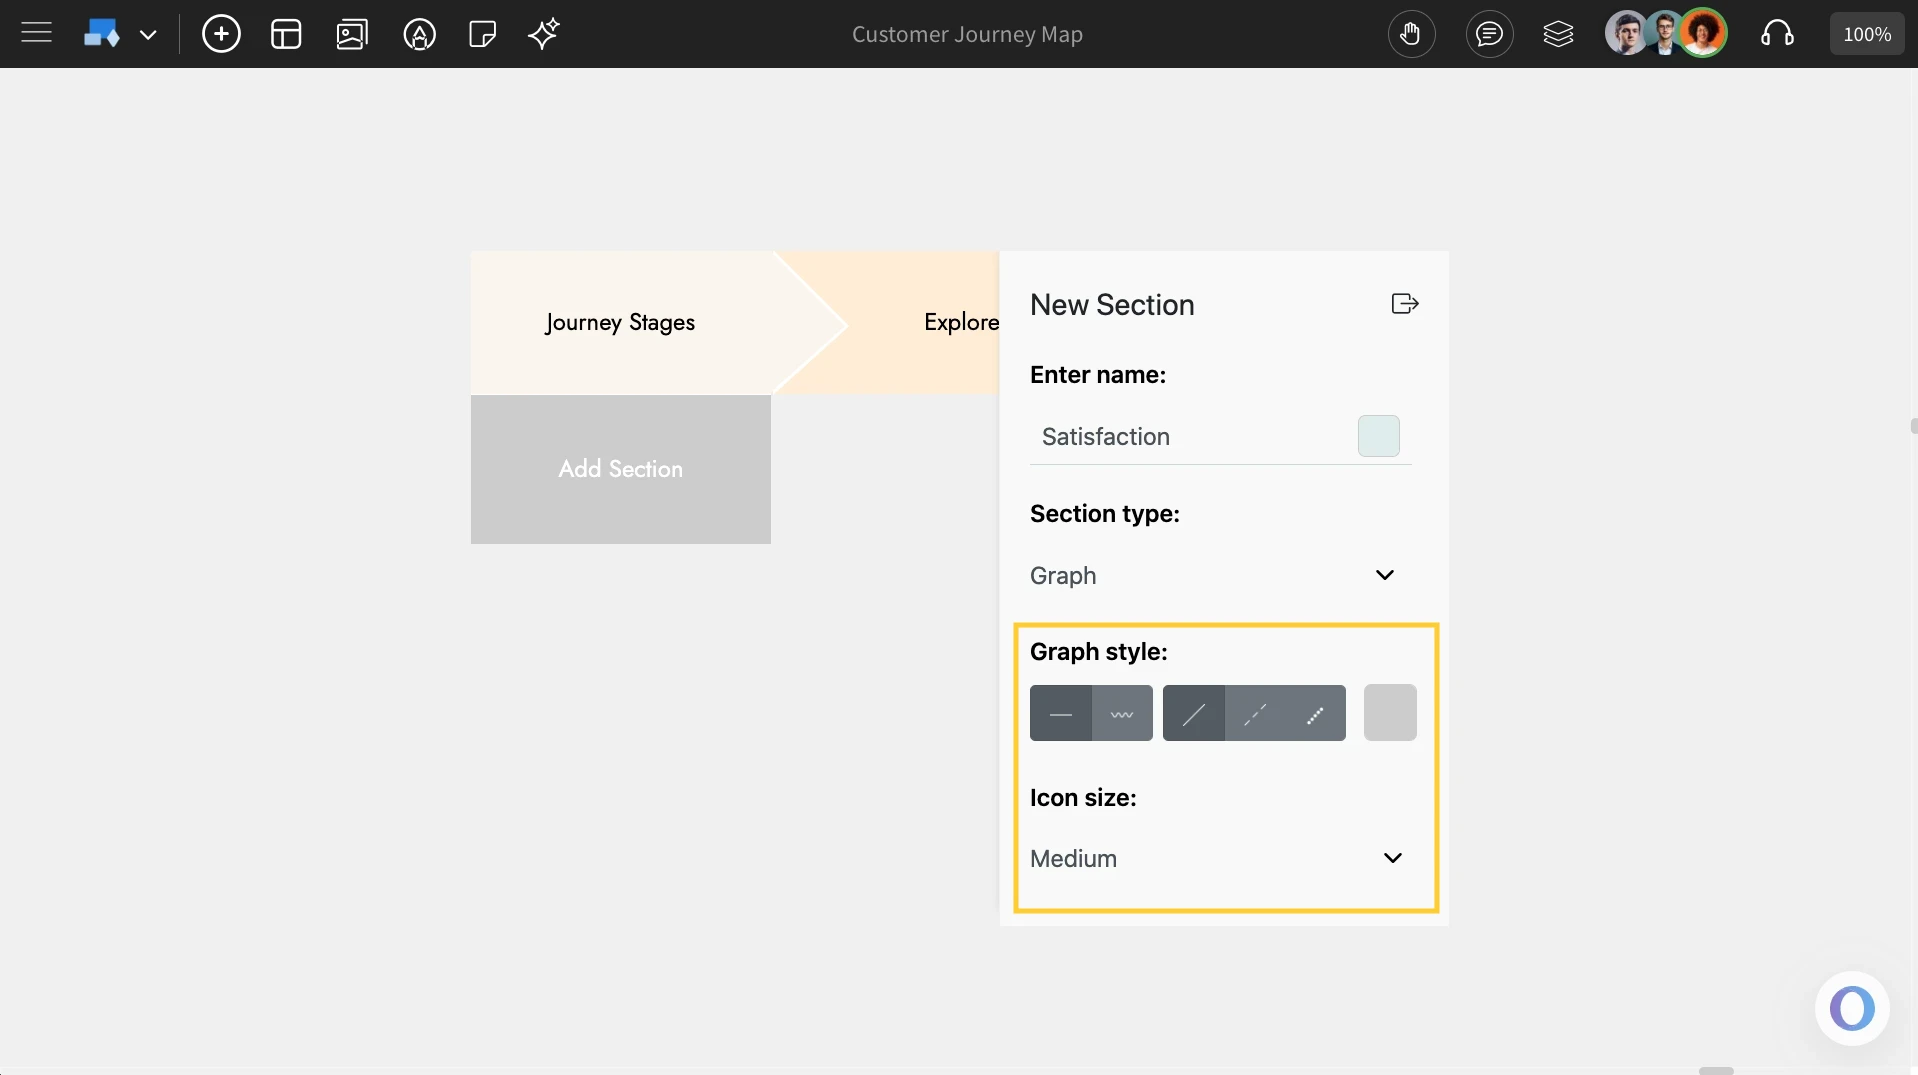
4. Graph
Use the Graph section type to represent the customer’s experience visually in a line graph format.
Choosing the Graph Type: You can access the Graph section type by clicking on ‘Add Section’. In the pop-up field, enter the section name, select ‘Graph’ as the section type.
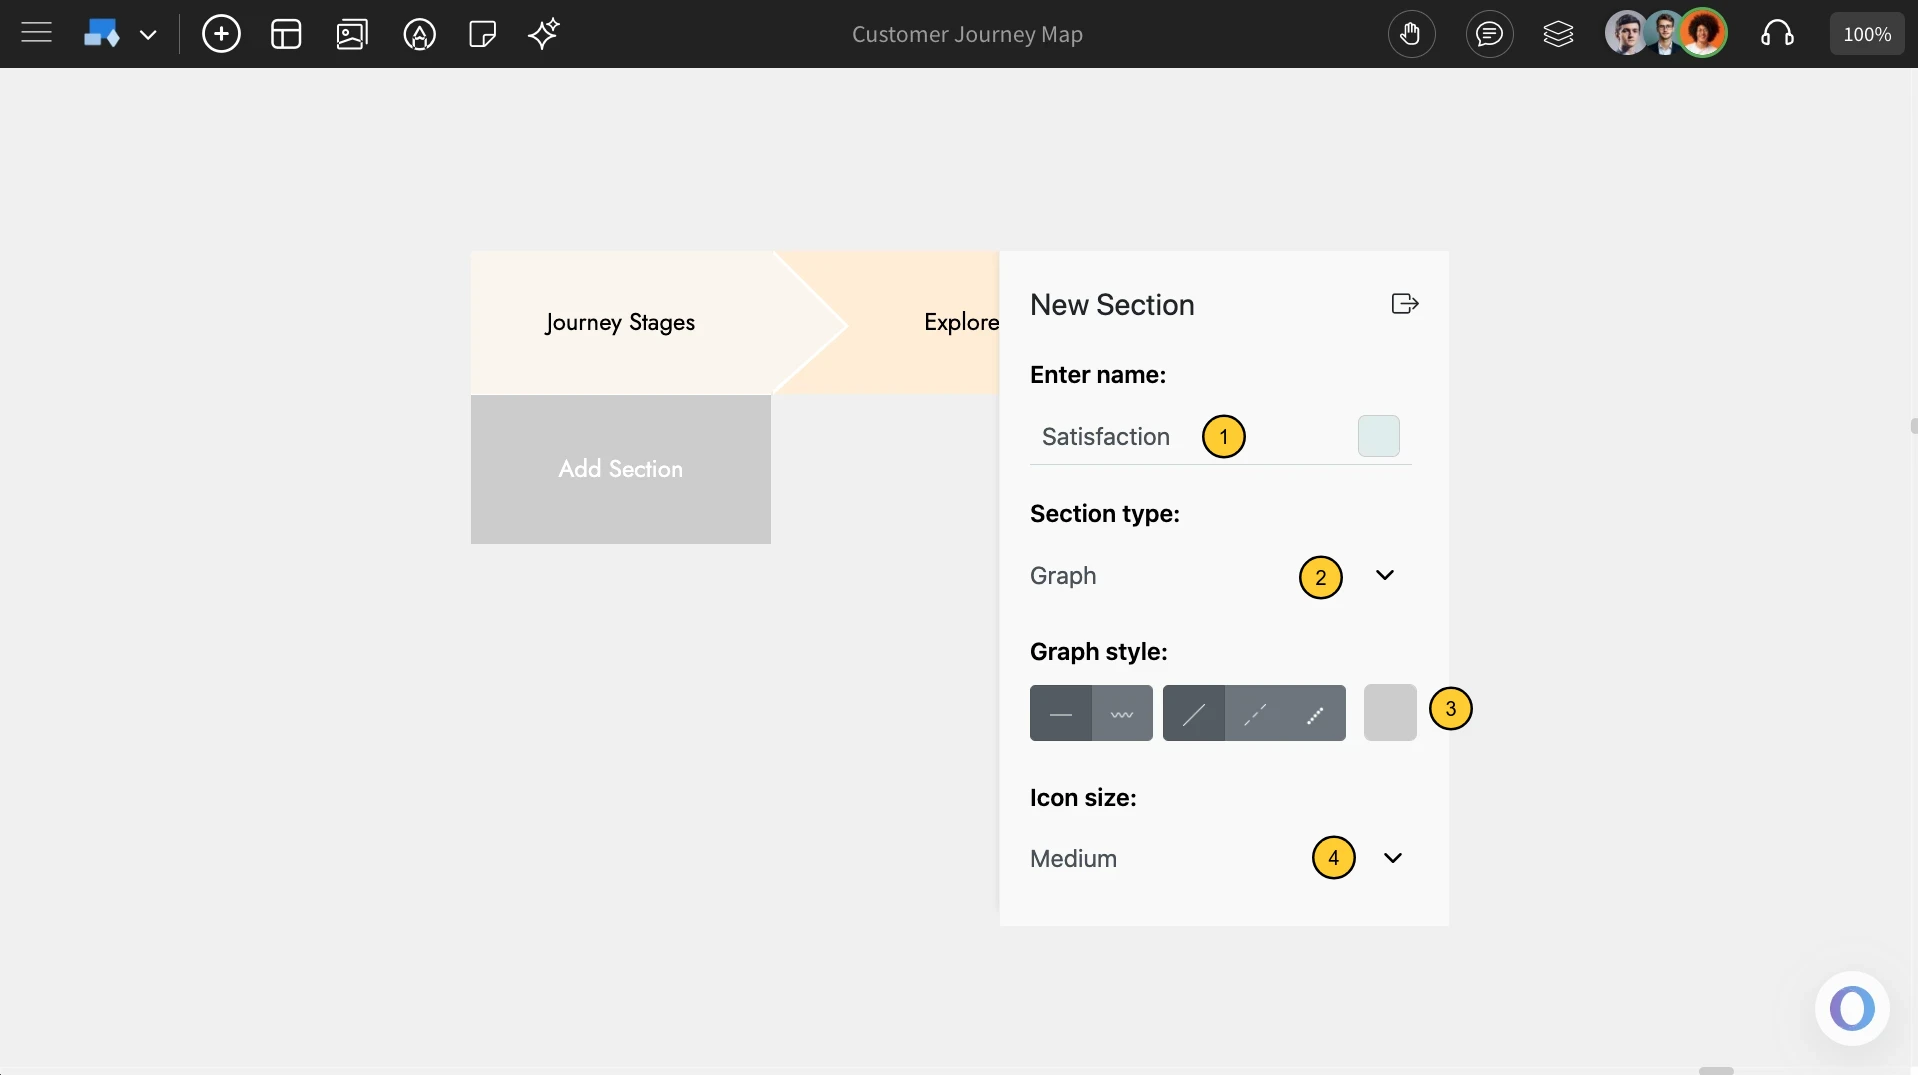
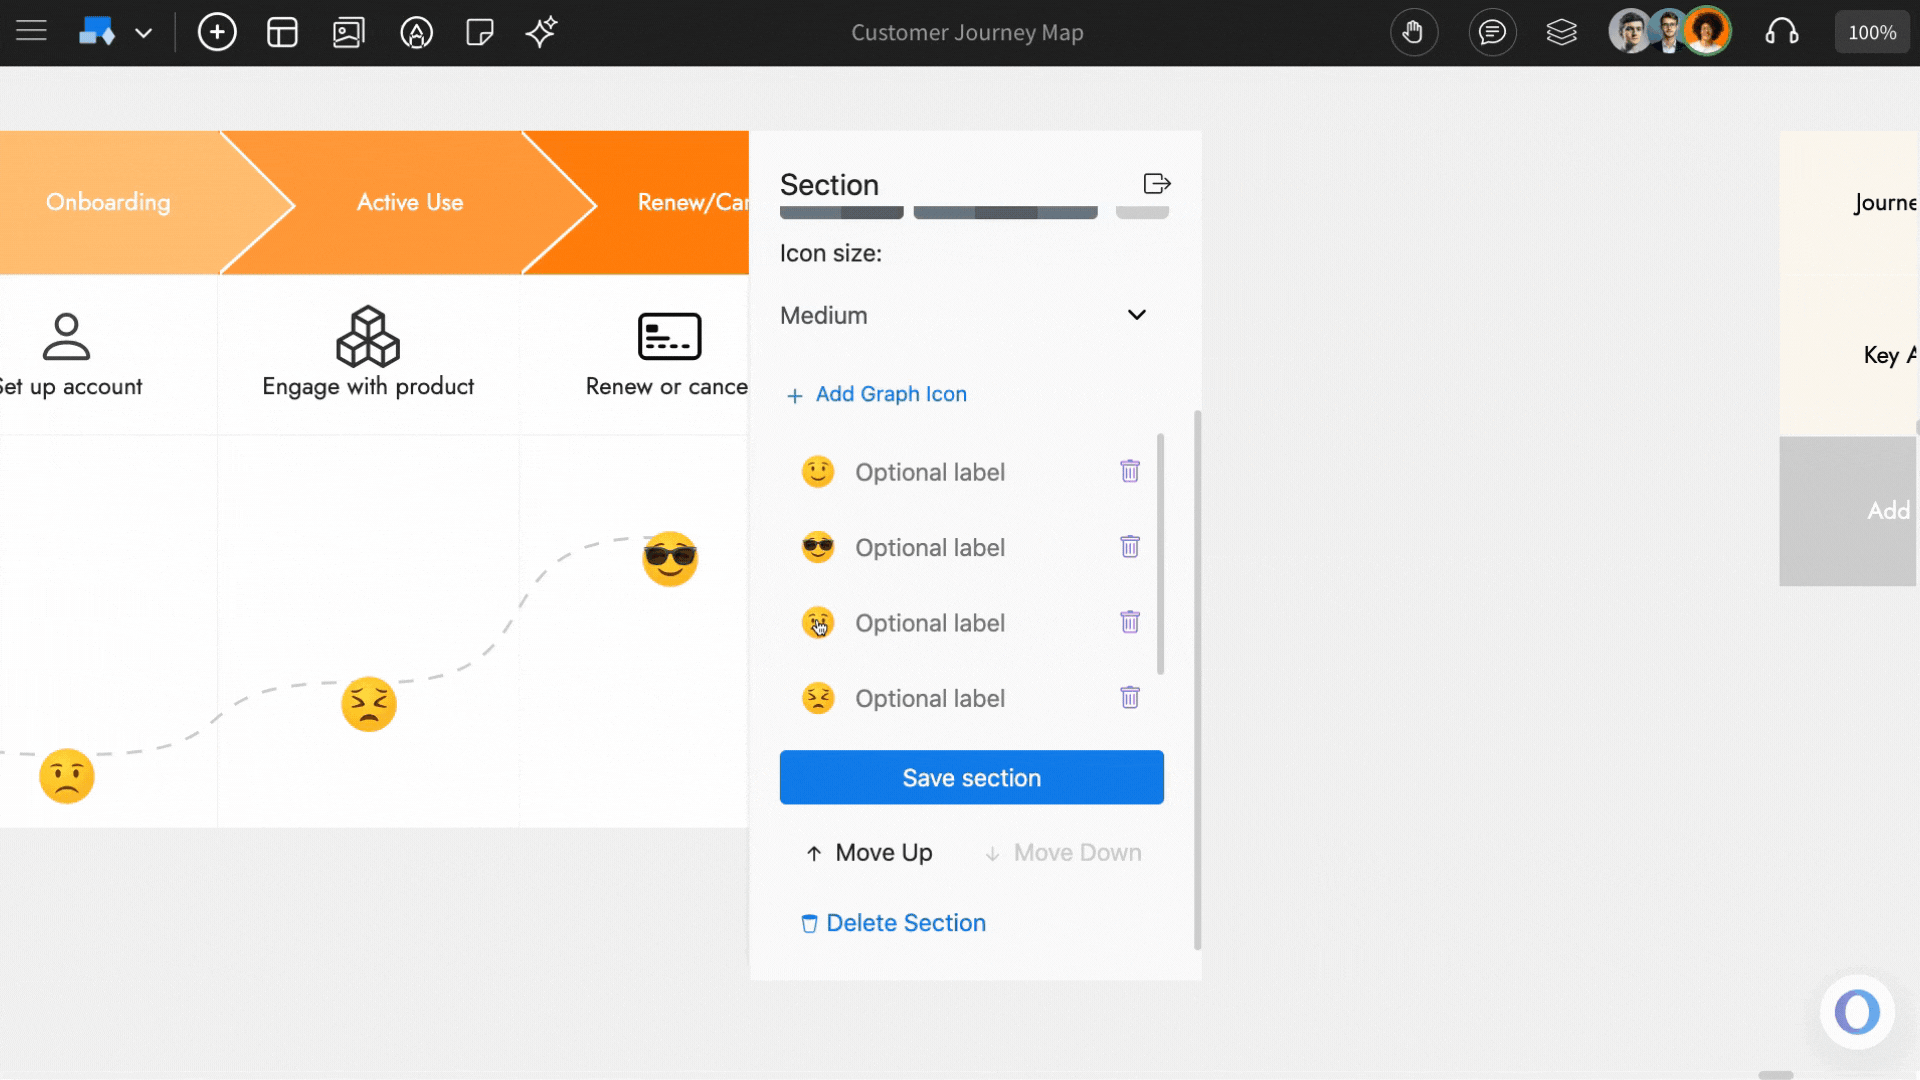
Customizing the Graph: Choose the graph style (e.g., straight line, dotted line, etc.) and customize the line color and icon size just like in other section types.
Adding Icons: Add icons to the graph by clicking ‘Add Graph Icons’ and choosing from the MockFlow IdeaBoard icon library.
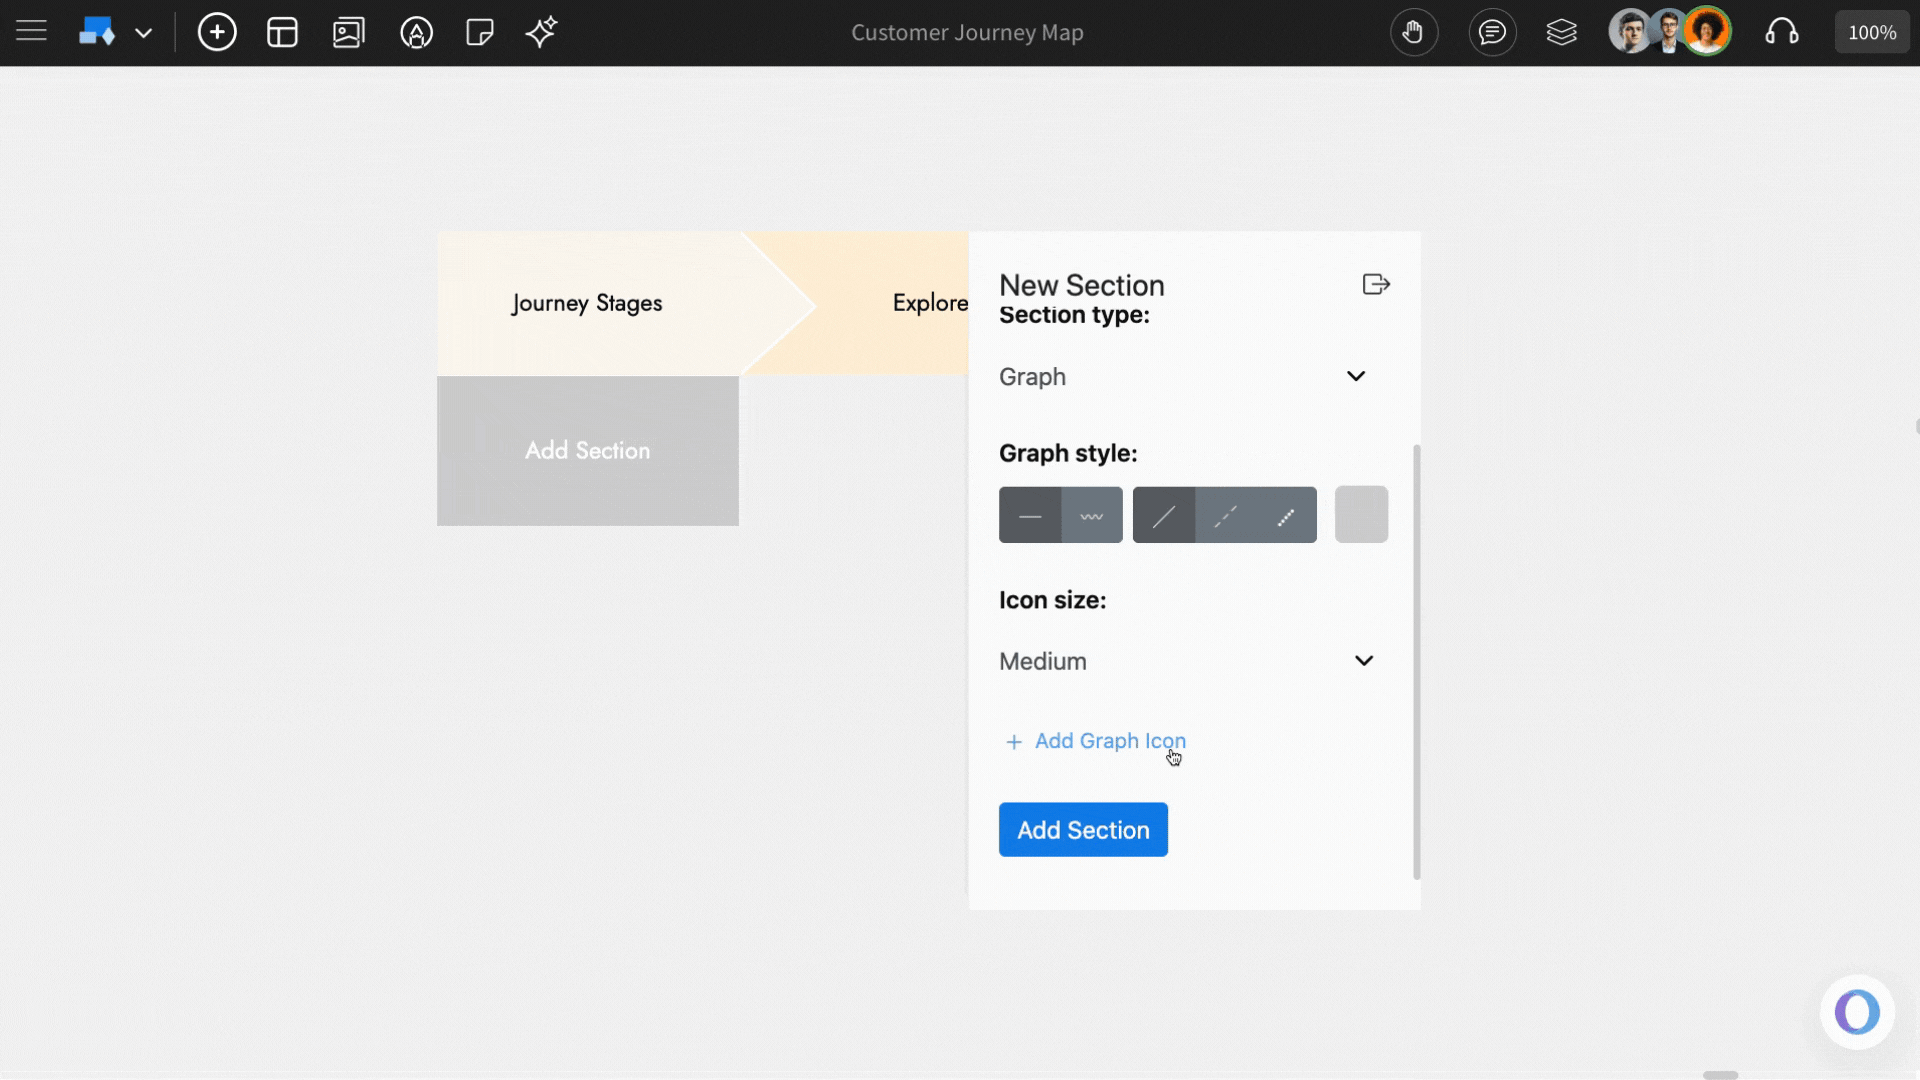
After choosing the above options, clcik on 'Add Section.'
Sorting the icons: You can reorder icons by dragging and dropping them, which dynamically adjusts the graph hierarchy.
Generating Customer Journey Map with AI: The customer journey map can be generated using AI from the quick toolbar itself.
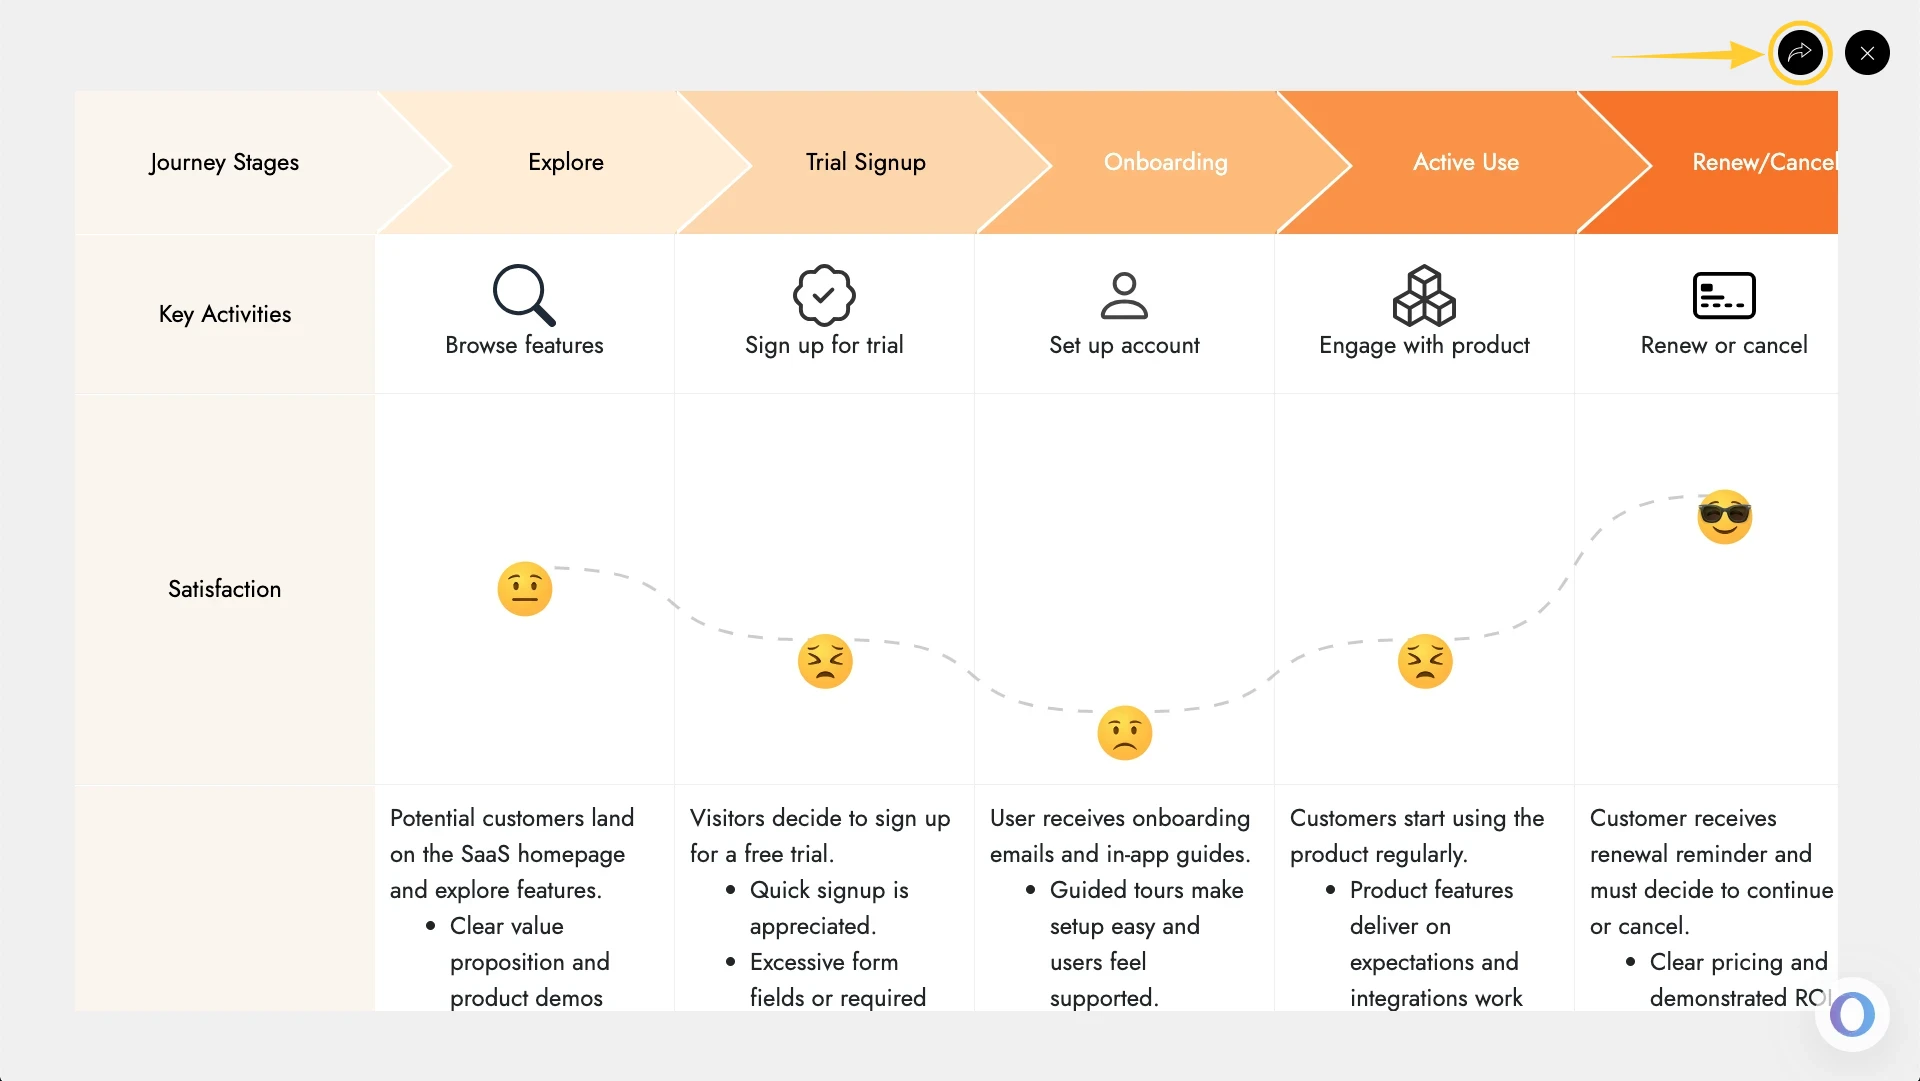
Using the Focus mode: There is an option to edit the customer journey map in a 'focus mode' where all other components of the board are hidden, and only the customer journey map component being edited is visible. To turn on this focus mode, click on the focus icon  in the quick toolbar (as shown below). To exit from the focus mode, click on the close icon at the top right.
Share component link with team: In focus mode, at the top right, there is a share icon next to the close icon. Click on this share icon to copy a unique link for the component view to share directly within your team.
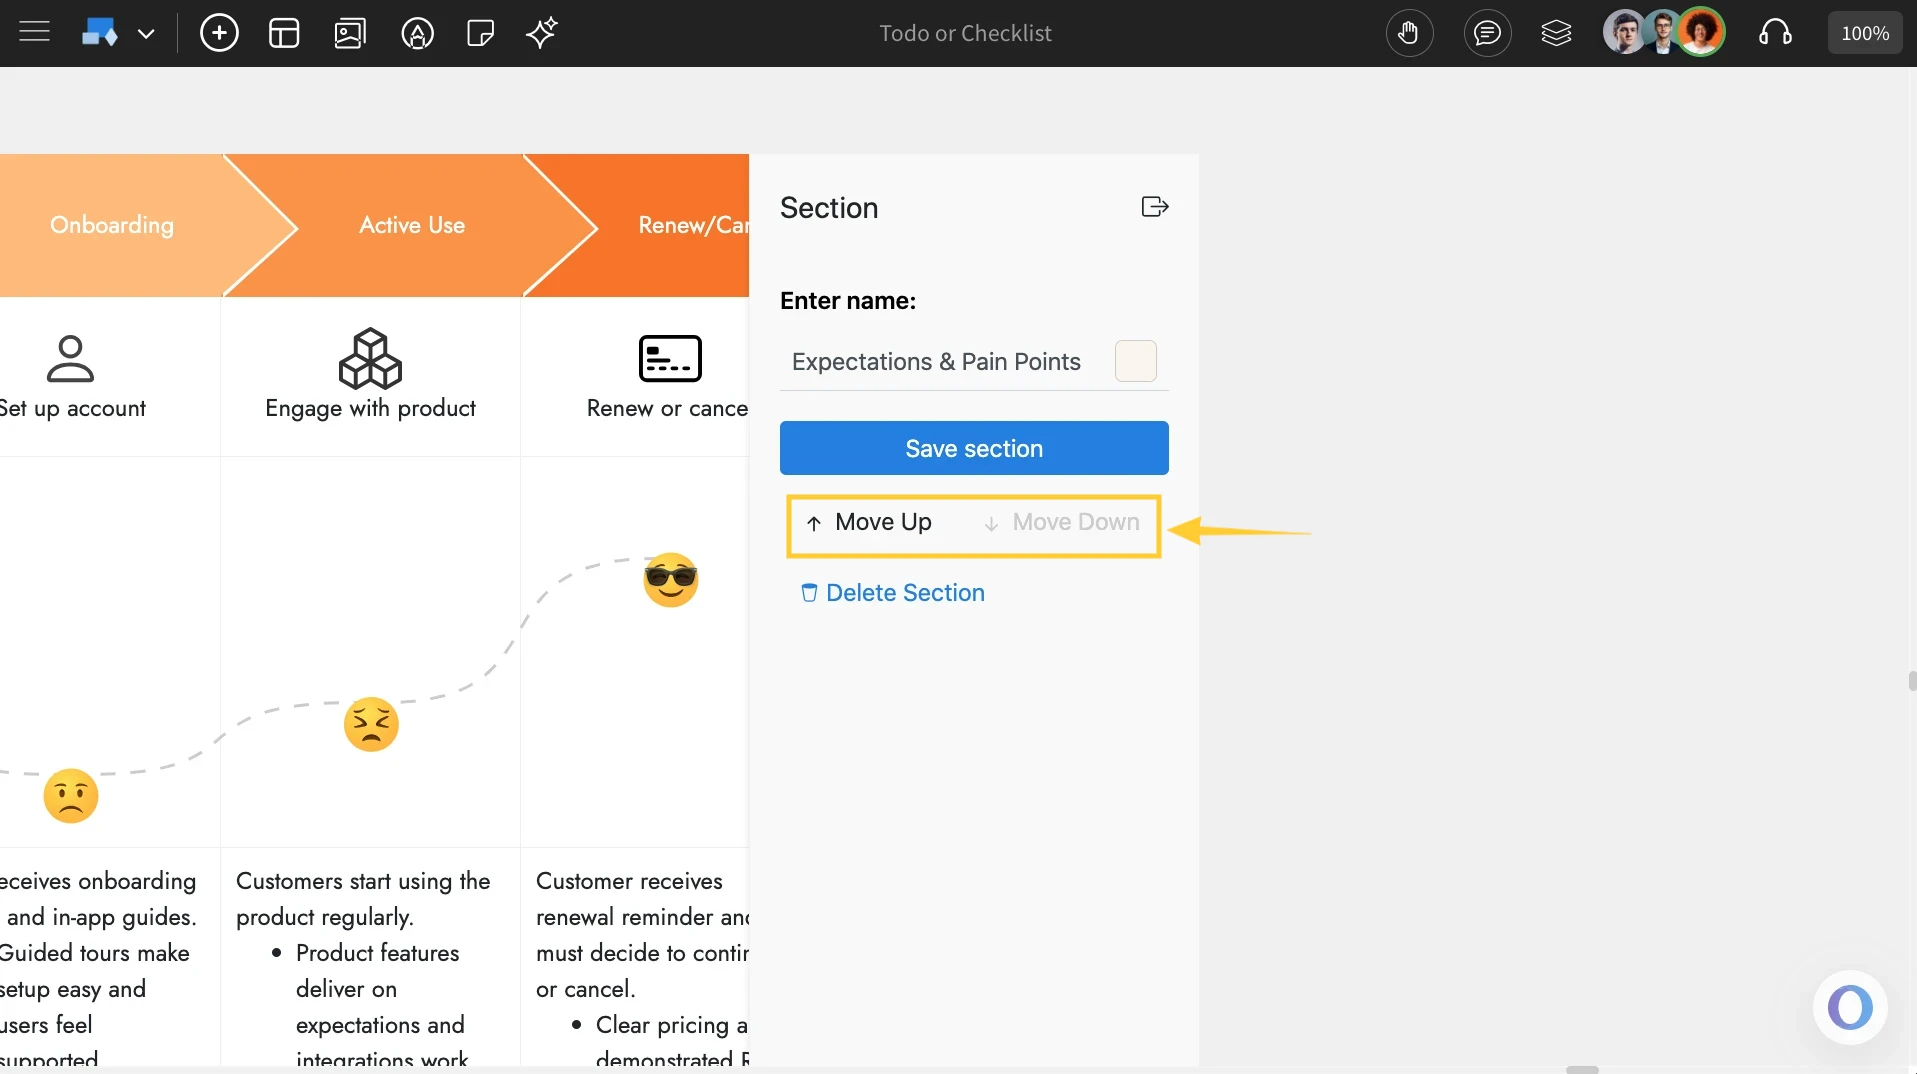
Sorting Sections in Customer Journey Map: You can reorder sections in the Customer Journey Map component by clicking on a section and selecting the ‘Move Up’ or ‘Move Down’ option.
Change Font styles: You can change the font family using the option in the quick toolbar.
Accessing the Advanced Settings: To access the advanced settings toolbar, click on the 'Toggle Advanced Settings' option from the quick toolbar.
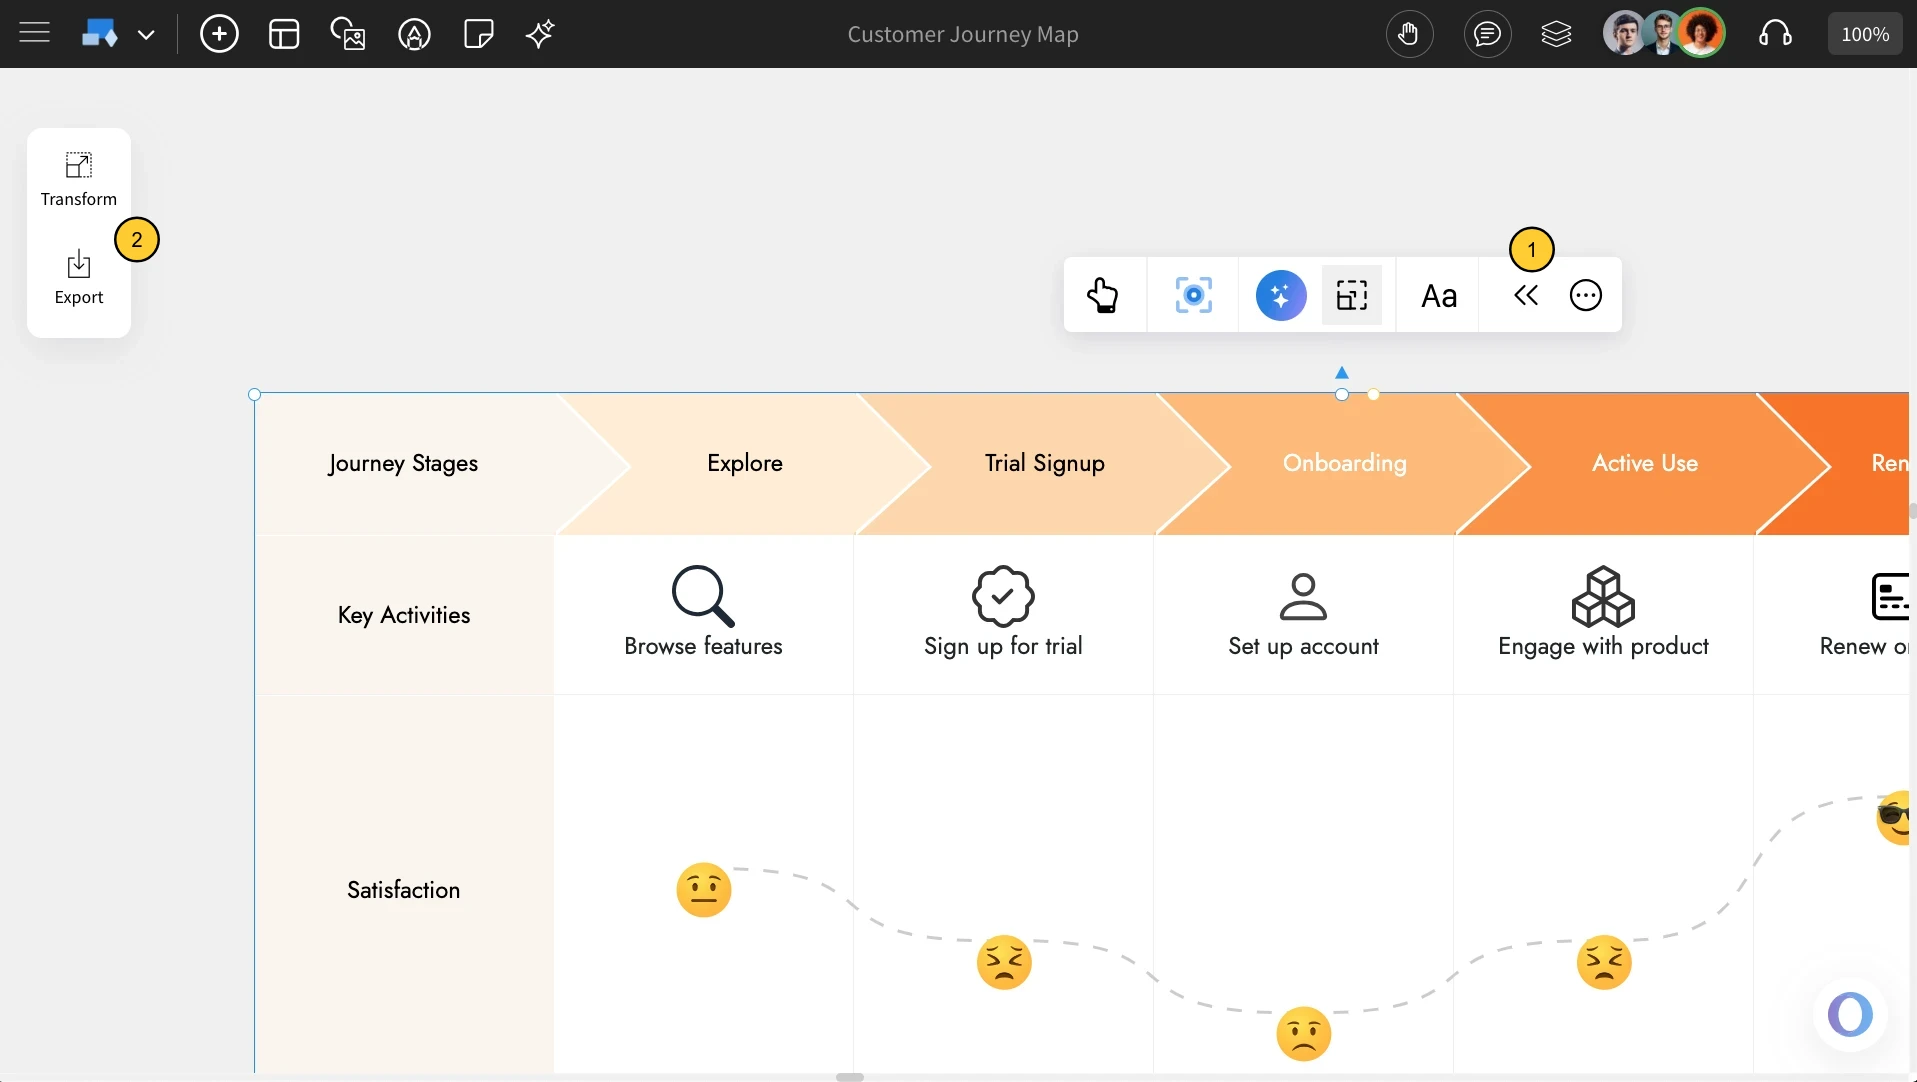
Exporting the CJM: You can export the Customer Journey Map as an image by clicking the 'Export' icon under Advanced Settings in the quick toolbar.