The Gantt Chart Component in IdeaBoard helps you visually plan and track tasks over time. It allows you to define tasks, assign timelines, and understand the sequence and overlap of activities - all directly within your whiteboard. This makes it ideal for project planning, roadmap creation, and timeline-based brainstorming.
Instead of managing timelines in separate tools, you can create and adjust your project schedule alongside related notes, diagrams, and ideas on the same board.
What is the Gantt Chart Component?
A Gantt chart is a timeline-based planning tool that shows tasks as horizontal bars across a calendar. Each bar represents the duration of a task, helping you see when tasks start, how long they last, and how they relate to other tasks.
How to add Gantt Chart in MockFlow IdeaBoard
Inside MockFlow IdeaBoard, click on the Plus (+) icon, search for Gantt Chart from the components list, and drag and drop it onto the canvas.
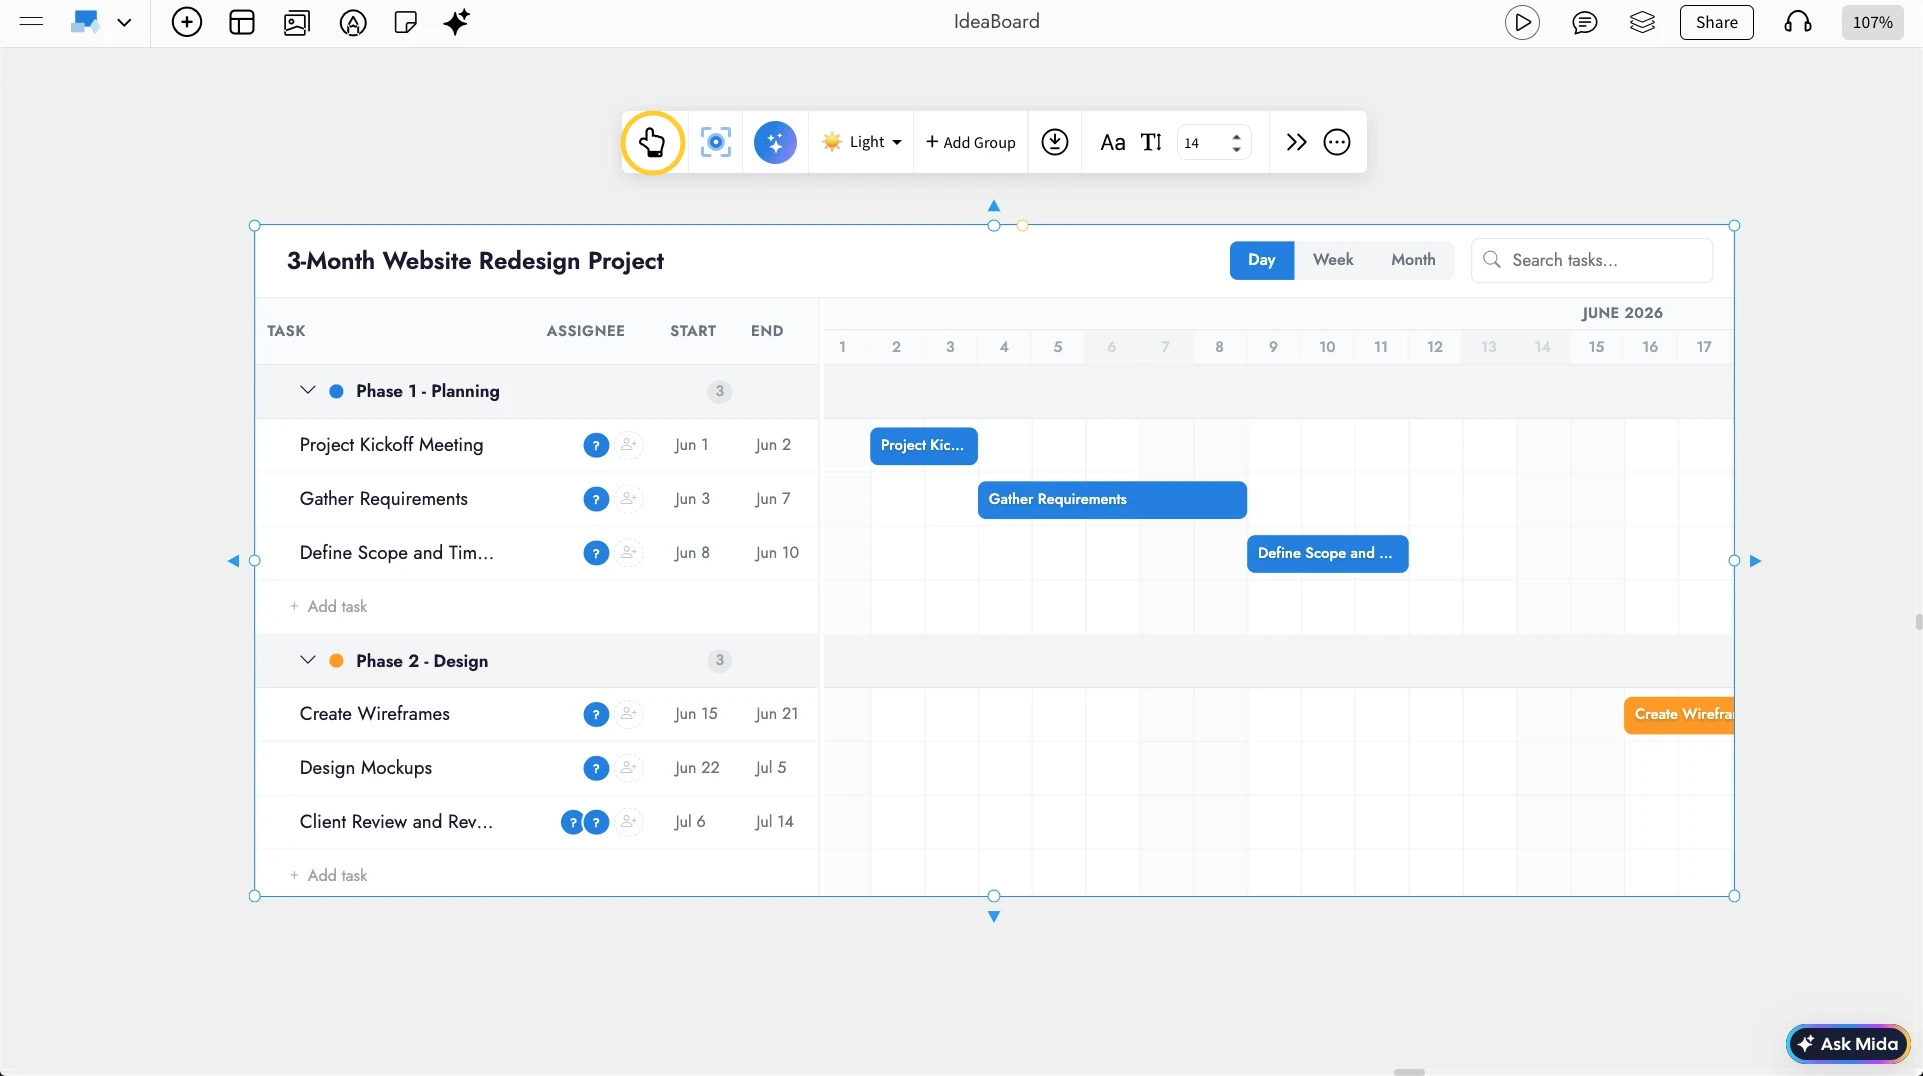
Editing the Gantt Chart: Use the Interact with Component option from the quick toolbar or just double-click on the component, to edit tasks inside the Gantt chart.
Double-click or click on the edit icon to add details to individual line items including dates, description, priority and assignee.
You can also drag the bar directly to edit the timeline.
There are weekly, daily and monthly view options available and there is also a search functionality to find tasks.
Other options detailed below in this order:
- Generate with AI
- Themes
- Adding groups
- Export Gantt chart
- Customize font styles
- Using focus mode
Generate Gantt Charts with AI:To quickly create a Gantt chart, use the AI option in the quick toolbar. Just enter a single prompt, and AI will generate a structured Gantt chart for you. You can then edit the AI-generated chart or even convert it into other components. To learn more about AI generation and conversions, we can check out the help article.

Customize the Gantt Chart with Themes: Switch the Gantt chart between light and dark themes using the theme options in the quick toolbar, making it easy to match different project styles or brand themes.

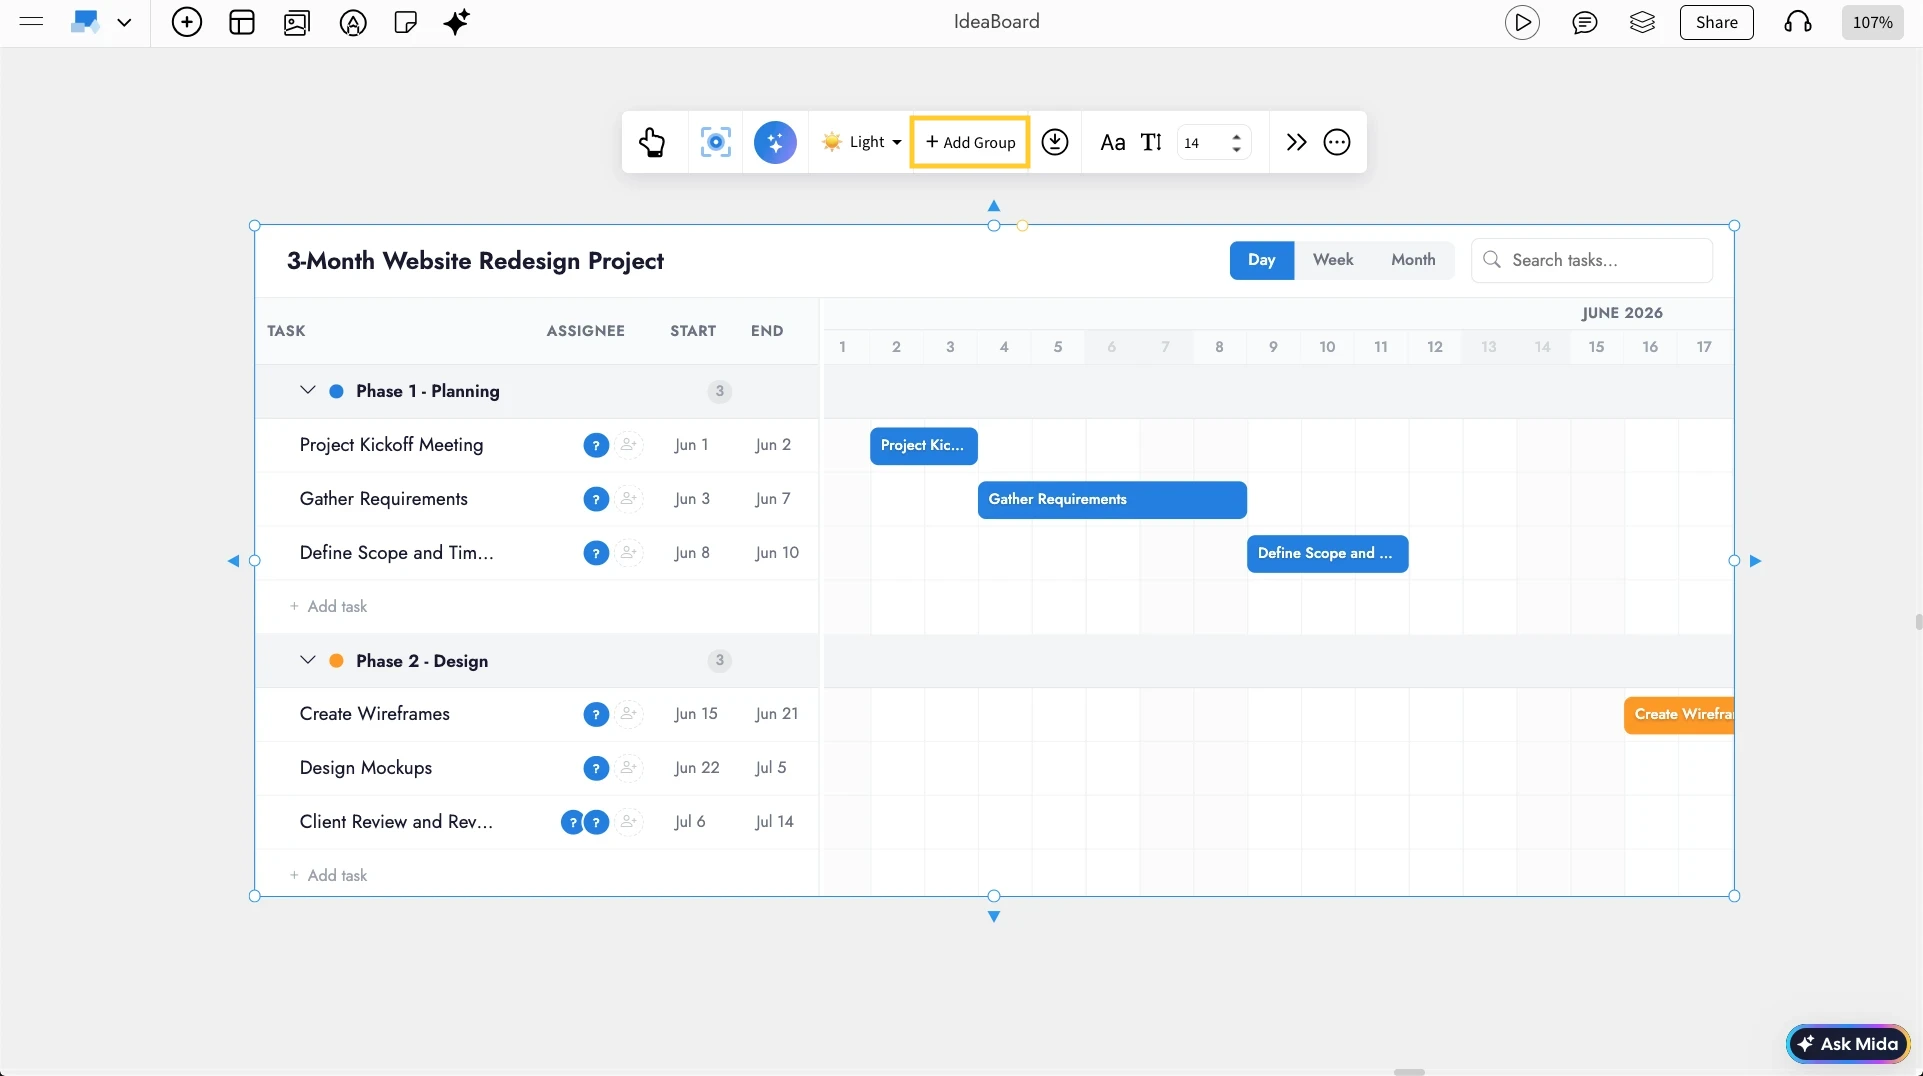
Categorize Tasks Using Groups: By using Add Groups, you can organize tasks into meaningful categories, such as phases, teams, or milestones, to keep the Gantt chart structured and easy to follow.
Exporting the Gantt Chart: You can use the Export option from the quick toolbar to export the Gantt chart as CSV or JSON format.

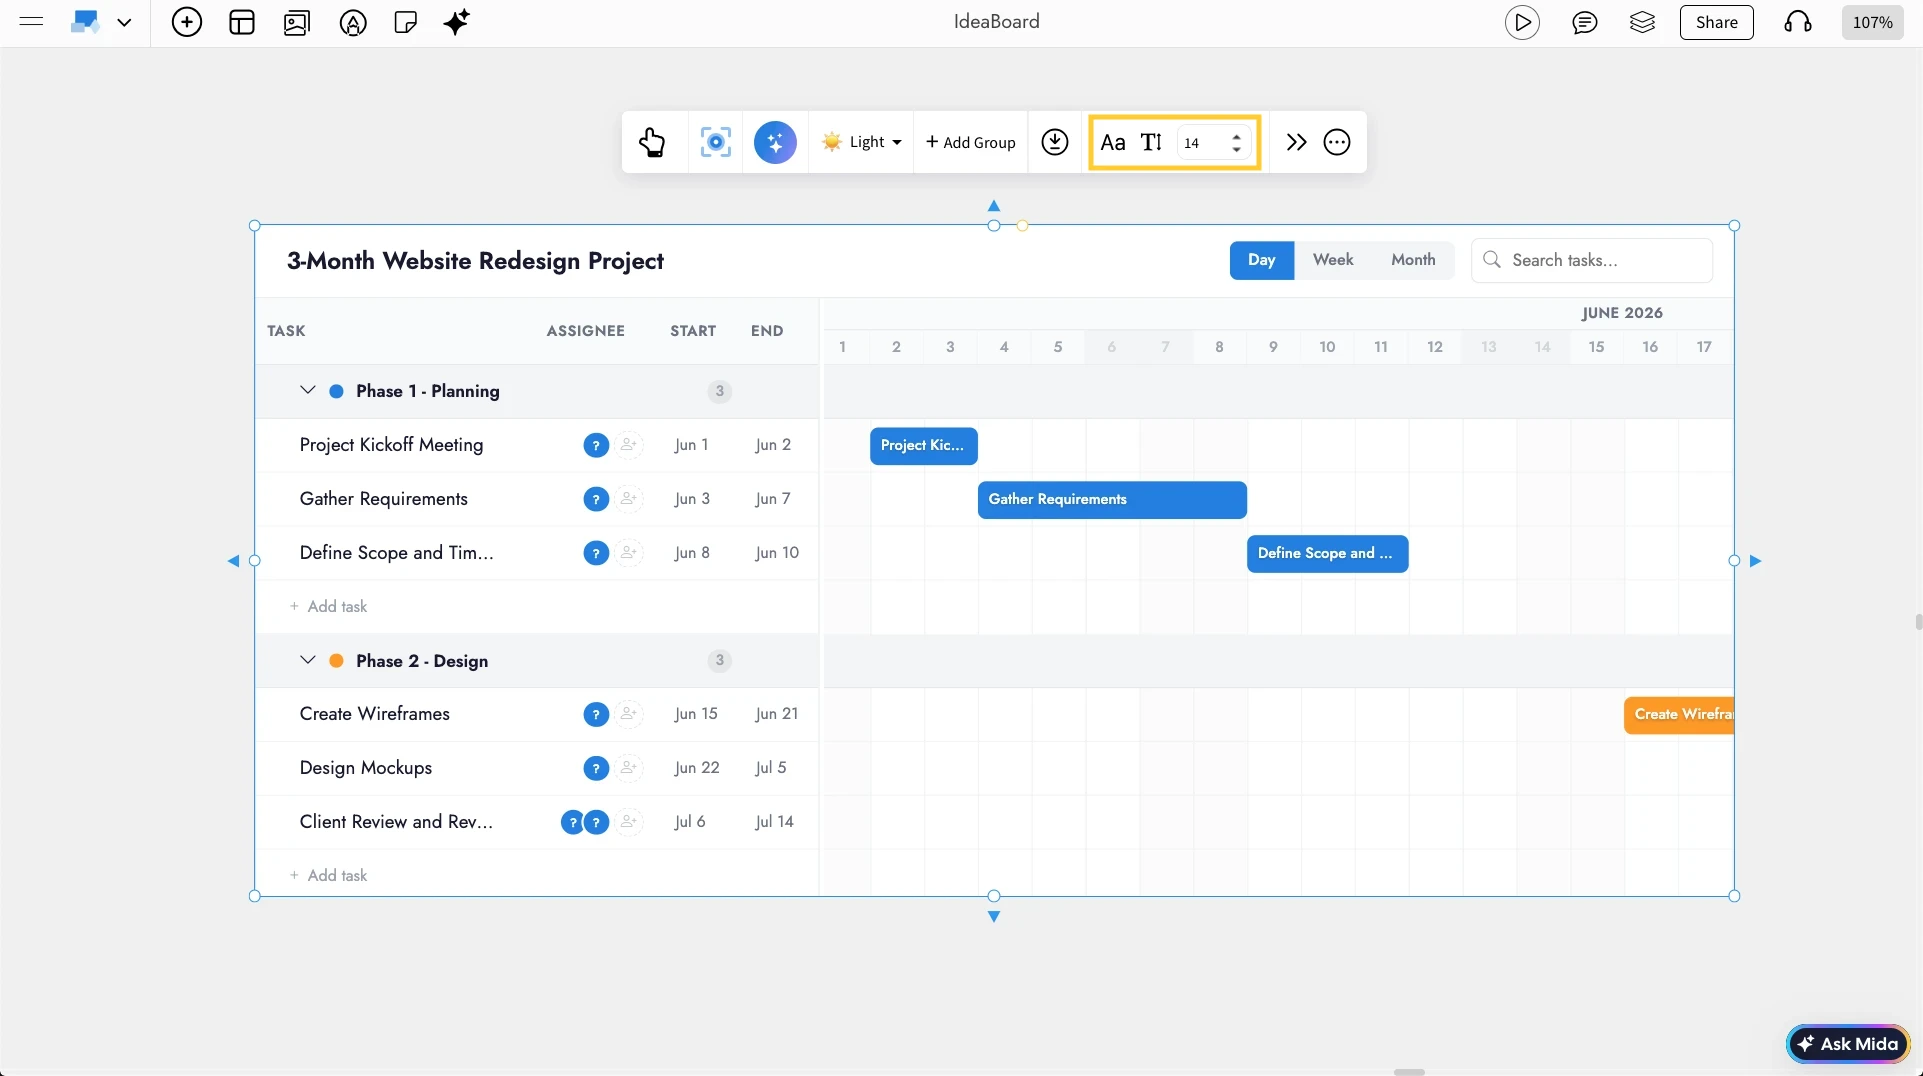
Adjusting the Font Settings: You can customize the font style and size using the Font Settings in the quick toolbar to improve readability and match our presentation style.
Use Focus Mode for Distraction-Free Planning: With Focus Mode enabled from the quick toolbar, you can work only on the Gantt chart without any distractions, as all other components are hidden from the canvas in the focus mode.

Use Cases
- Product roadmaps: Plan feature releases and development phases.
- Marketing campaigns: Track campaign milestones such as planning, design, launch, and analysis.
- Sprint planning: Visualize sprint timelines, deliverables, and deadlines.
- Project management: Organize tasks across phases like research, design, development, and testing.


